|
800
|
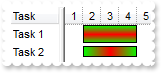
How can copy and paste the selection to Microsoft Word, any OLE compliant application, as a snapshot
<BODY onload="Init()">
<OBJECT CLASSID="clsid:09C0C400-3A0F-4CD3-8B93-8D42FCE66726" id="Gantt1"></OBJECT>

<SCRIPT LANGUAGE="VBScript">
Function Init()
	With Gantt1
		.BeginUpdate
		.VisualAppearance.Add 1,"c:\exontrol\images\normal.ebn"
		.HTMLPicture("p1") = "c:\exontrol\images\card.png"
		.HTMLPicture("p2") = "c:\exontrol\images\sun.png"
		.AutoDrag = 11
		.LinesAtRoot = 0
		.HasLines = 2
		.ShowFocusRect = False
		.DefaultItemHeight = 26
		.Columns.Add "Task"
		With .Chart
			.ShowNonworkingDates = False
			.FirstVisibleDate = #12/29/2000#
			.PaneWidth(False) = 96
			.LevelCount = 2
			With .Bars.Item("Task")
				.Color = &H1000000
				.Height = 18
			End With
		End With
		With .Items
			h = .AddItem("<img>p1:32</img>Group 1")
			.CellCaptionFormat(h,0) = 1
			.ItemDivider(h) = 0
			.ItemBold(h) = True
			h1 = .InsertItem(h,,"Task 1")
			.AddBar h1,"Task",#1/2/2001#,#1/4/2001#,"K1"
			h2 = .InsertItem(h,,"Task 2")
			.AddBar h2,"Task",#1/5/2001#,#1/7/2001#,"K2"
			.AddLink "L1",h1,"K1",h2,"K2"
			.Link("L1",12) = "L1"
			h3 = .InsertItem(h,,"Task 3")
			.AddBar h3,"Task",#1/8/2001#,#1/10/2001#,"K3"
			.AddLink "L2",h2,"K2",h3,"K3"
			.Link("L2",12) = "L2"
			h = .AddItem("<img>p2:32</img>Group 2")
			.CellCaptionFormat(h,0) = 1
			.ItemBold(h) = True
			.ItemDivider(h) = 0
			h1 = .InsertItem(h,,"Task")
			.AddBar h1,"Task",#1/2/2001#,#1/4/2001#,"K1"
			.ExpandItem(0) = True
		End With
		.EndUpdate
	End With
End Function
</SCRIPT>
</BODY>
|
|
799
|
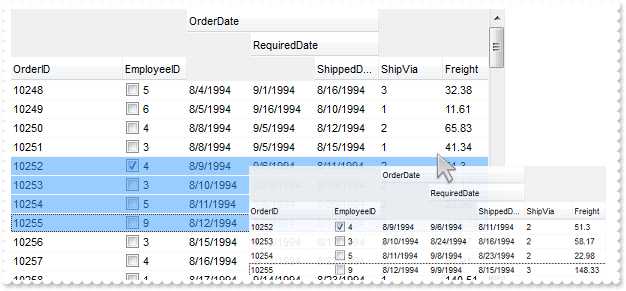
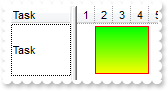
How can copy and paste the selection to Microsoft Word, any OLE compliant application, as a image
<BODY onload="Init()">
<OBJECT CLASSID="clsid:09C0C400-3A0F-4CD3-8B93-8D42FCE66726" id="Gantt1"></OBJECT>

<SCRIPT LANGUAGE="VBScript">
Function Init()
	With Gantt1
		.BeginUpdate
		.HTMLPicture("p1") = "c:\exontrol\images\card.png"
		.HTMLPicture("p2") = "c:\exontrol\images\sun.png"
		.Chart.PaneWidth(True) = 0
		var_HTMLPicture = .HTMLPicture("aka1")
		.HeaderHeight = 24
		.DefaultItemHeight = 48
		.DrawGridLines = -2
		.GridLineColor = RGB(240,240,240)
		.SelBackMode = 1
		.ColumnAutoResize = False
		.ContinueColumnScroll = False
		Set rs = CreateObject("ADOR.Recordset")
		With rs
			.Open "Orders","Provider=Microsoft.ACE.OLEDB.12.0;Data Source=C:\Program Files\Exontrol\ExGantt\Sample\Access\SAMPLE.MDB",3,3
		End With
		.DataSource = rs
		.Columns.Item(0).Def(17) = 1
		.Columns.Item(0).FormatColumn = "value + ` <img>p` + (1 + (value mod 3 ) ) + `</img>`"
		.Columns.Item(0).Width = 112
		.Columns.Item(1).Def(0) = 1
		.Columns.Item(2).LevelKey = "1"
		.Columns.Item(3).LevelKey = "1"
		.Columns.Item(4).LevelKey = "1"
		.AutoDrag = 10
		.SingleSel = False
		With .Items
			h = .ItemByIndex(1)
			.SelectItem(h) = True
			h = .ItemByIndex(2)
			.SelectItem(h) = True
			h = .ItemByIndex(3)
			.SelectItem(h) = True
			.LockedItemCount(2) = 1
			h = .LockedItem(2,0)
			.CellCaption(h,1) = "<font ;16>Click the selection and <b>wait to start dragging</b>, and then drop to Microsoft Word, ..."
			.CellSingleLine(h,1) = False
			.CellCaptionFormat(h,1) = 1
			.CellHAlignment(h,1) = 1
			.ItemDivider(h) = 1
			.ItemDividerLineAlignment(h) = 2
		End With
		.EndUpdate
	End With
End Function
</SCRIPT>
</BODY>
|
|
798
|
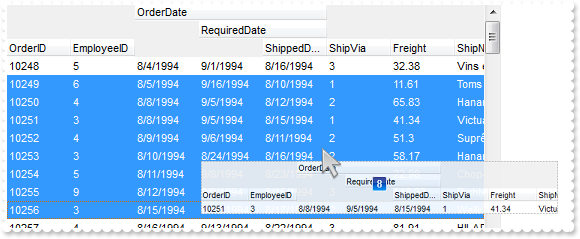
How can copy and paste the selection to Microsoft Word, Excel or any OLE compliant application, as a text
<BODY onload="Init()">
<OBJECT CLASSID="clsid:09C0C400-3A0F-4CD3-8B93-8D42FCE66726" id="Gantt1"></OBJECT>

<SCRIPT LANGUAGE="VBScript">
Function Init()
	With Gantt1
		.BeginUpdate
		.Chart.PaneWidth(True) = 0
		.ColumnAutoResize = False
		.ContinueColumnScroll = False
		Set rs = CreateObject("ADOR.Recordset")
		With rs
			.Open "Orders","Provider=Microsoft.ACE.OLEDB.12.0;Data Source=C:\Program Files\Exontrol\ExGantt\Sample\Access\SAMPLE.MDB",3,3
		End With
		.DataSource = rs
		.Columns.Item(2).LevelKey = "1"
		.Columns.Item(3).LevelKey = "1"
		.Columns.Item(4).LevelKey = "1"
		.AutoDrag = 9
		.SingleSel = False
		With .Items
			h = .ItemByIndex(1)
			.SelectItem(h) = True
			h = .ItemByIndex(3)
			.SelectItem(h) = True
			h = .ItemByIndex(4)
			.SelectItem(h) = True
			h = .ItemByIndex(5)
			.SelectItem(h) = True
			.LockedItemCount(2) = 1
			h = .LockedItem(2,0)
			.CellCaption(h,0) = "<font ;16>Click the selection and <b>wait to start dragging</b>, and then drop to Microsoft Word, Excel, ..."
			.CellSingleLine(h,0) = False
			.CellCaptionFormat(h,0) = 1
			.CellHAlignment(h,0) = 1
			.ItemDivider(h) = 0
			.ItemDividerLineAlignment(h) = 2
		End With
		.EndUpdate
	End With
End Function
</SCRIPT>
</BODY>
|
|
797
|
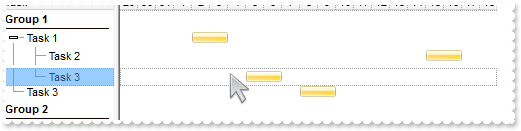
Is it possible to change the indentation during the drag and drop
<BODY onload="Init()">
<OBJECT CLASSID="clsid:09C0C400-3A0F-4CD3-8B93-8D42FCE66726" id="Gantt1"></OBJECT>

<SCRIPT LANGUAGE="VBScript">
Function Init()
	With Gantt1
		.BeginUpdate
		.VisualAppearance.Add 1,"c:\exontrol\images\normal.ebn"
		.AutoDrag = 3
		.LinesAtRoot = 0
		.HasLines = 1
		.HasButtons = 3
		.ShowFocusRect = False
		.SelBackMode = 1
		.Columns.Add "Task"
		With .Chart
			.ShowNonworkingDates = False
			.FirstVisibleDate = #12/29/2000#
			.PaneWidth(False) = 128
			.LevelCount = 2
			.Bars.Item("Task").Color = &H1000000
		End With
		With .Items
			h = .AddItem("Group 1")
			.ItemBold(h) = True
			.ItemDivider(h) = 0
			h1 = .InsertItem(h,,"Task 1")
			.AddBar h1,"Task",#1/2/2001#,#1/4/2001#,"K1"
			h2 = .InsertItem(h1,,"Task 2")
			.AddBar h2,"Task",#1/15/2001#,#1/17/2001#,"K4"
			h2 = .InsertItem(h1,,"Task 3")
			.AddBar h2,"Task",#1/5/2001#,#1/7/2001#,"K2"
			.AddLink "L1",h1,"K1",h2,"K2"
			.Link("L1",12) = "L1"
			h3 = .InsertItem(h,,"Task 3")
			.AddBar h3,"Task",#1/8/2001#,#1/10/2001#,"K3"
			.AddLink "L2",h2,"K2",h3,"K3"
			.Link("L2",12) = "L2"
			.ExpandItem(h) = True
			.ExpandItem(h1) = True
			h = .AddItem("Group 2")
			.ItemBold(h) = True
			.ItemDivider(h) = 0
			.LockedItemCount(2) = 1
			h = .LockedItem(2,0)
			.CellCaption(h,0) = "Click a row, and move by dragging <b>up, down</b> to change the row's parent or <b>left,right</b> to increase or decrease the i" & _
		"ndentation."
			.CellSingleLine(h,0) = False
			.CellCaptionFormat(h,0) = 1
		End With
		.EndUpdate
	End With
End Function
</SCRIPT>
</BODY>
|
|
796
|
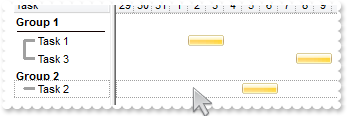
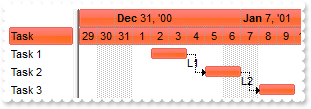
Is it possible to allow moving an item to another, but keeping its indentation
<BODY onload="Init()">
<OBJECT CLASSID="clsid:09C0C400-3A0F-4CD3-8B93-8D42FCE66726" id="Gantt1"></OBJECT>

<SCRIPT LANGUAGE="VBScript">
Function Init()
	With Gantt1
		.BeginUpdate
		.VisualAppearance.Add 1,"c:\exontrol\images\normal.ebn"
		.AutoDrag = 2
		.LinesAtRoot = 0
		.HasLines = 2
		.ShowFocusRect = False
		.Columns.Add "Task"
		With .Chart
			.ShowNonworkingDates = False
			.FirstVisibleDate = #12/29/2000#
			.PaneWidth(False) = 96
			.LevelCount = 2
			.Bars.Item("Task").Color = &H1000000
		End With
		With .Items
			h = .AddItem("Group 1")
			.ItemDivider(h) = 0
			.ItemBold(h) = True
			h1 = .InsertItem(h,,"Task 1")
			.AddBar h1,"Task",#1/2/2001#,#1/4/2001#,"K1"
			h2 = .InsertItem(h,,"Task 2")
			.AddBar h2,"Task",#1/5/2001#,#1/7/2001#,"K2"
			.AddLink "L1",h1,"K1",h2,"K2"
			.Link("L1",12) = "L1"
			h3 = .InsertItem(h,,"Task 3")
			.AddBar h3,"Task",#1/8/2001#,#1/10/2001#,"K3"
			.AddLink "L2",h2,"K2",h3,"K3"
			.Link("L2",12) = "L2"
			.ExpandItem(h) = True
			h = .AddItem("Group 2")
			.ItemBold(h) = True
			.ItemDivider(h) = 0
		End With
		.EndUpdate
	End With
End Function
</SCRIPT>
</BODY>
|
|
795
|
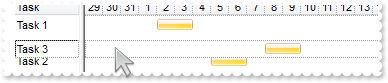
How can I change the row's position to another, by drag and drop. Is it possible
<BODY onload="Init()">
<OBJECT CLASSID="clsid:09C0C400-3A0F-4CD3-8B93-8D42FCE66726" id="Gantt1"></OBJECT>

<SCRIPT LANGUAGE="VBScript">
Function Init()
	With Gantt1
		.BeginUpdate
		.VisualAppearance.Add 1,"c:\exontrol\images\normal.ebn"
		.AutoDrag = 1
		.Columns.Add "Task"
		With .Chart
			.ShowNonworkingDates = False
			.FirstVisibleDate = #12/29/2000#
			.PaneWidth(False) = 64
			.LevelCount = 2
			.Bars.Item("Task").Color = &H1000000
		End With
		With .Items
			h1 = .AddItem("Task 1")
			.AddBar h1,"Task",#1/2/2001#,#1/4/2001#,"K1"
			h2 = .AddItem("Task 2")
			.AddBar h2,"Task",#1/5/2001#,#1/7/2001#,"K2"
			.AddLink "L1",h1,"K1",h2,"K2"
			.Link("L1",12) = "L1"
			h3 = .AddItem("Task 3")
			.AddBar h3,"Task",#1/8/2001#,#1/10/2001#,"K3"
			.AddLink "L2",h2,"K2",h3,"K3"
			.Link("L2",12) = "L2"
		End With
		.EndUpdate
	End With
End Function
</SCRIPT>
</BODY>
|
|
794
|
Have seen the RenderType, but do not know what kind of values should I use
<BODY onload="Init()">
<OBJECT CLASSID="clsid:09C0C400-3A0F-4CD3-8B93-8D42FCE66726" id="Gantt1"></OBJECT>

<SCRIPT LANGUAGE="VBScript">
Function Init()
	With Gantt1
		.BeginUpdate
		.VisualAppearance.Add 1,"c:\exontrol\images\normal.ebn"
		.Columns.Add "Task"
		.BackColorHeader = &H1000000
		With .Chart
			.BackColorLevelHeader = &H1000000
			.FirstVisibleDate = #12/29/2000#
			.PaneWidth(False) = 64
			.LevelCount = 2
			.Bars.Item("Task").Color = &H1000000
		End With
		With .Items
			h1 = .AddItem("Task 1")
			.AddBar h1,"Task",#1/2/2001#,#1/4/2001#,"K1"
			h2 = .AddItem("Task 2")
			.AddBar h2,"Task",#1/5/2001#,#1/7/2001#,"K2"
			.AddLink "L1",h1,"K1",h2,"K2"
			.Link("L1",12) = "L1"
			h3 = .AddItem("Task 3")
			.AddBar h3,"Task",#1/8/2001#,#1/10/2001#,"K3"
			.AddLink "L2",h2,"K2",h3,"K3"
			.Link("L2",12) = "L2"
		End With
		.VisualAppearance.RenderType = -2147483393
		.EndUpdate
	End With
End Function
</SCRIPT>
</BODY>
|
|
793
|
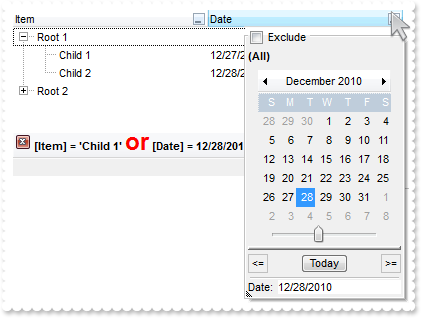
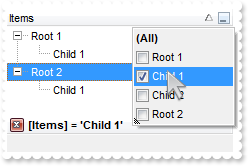
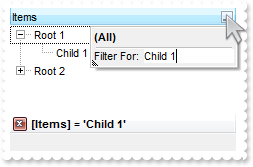
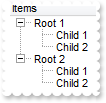
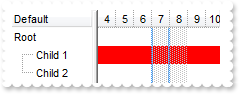
I have several columns, but noticed that the filter is using AND between columns, but I need OR clause for filtering. Is it possible
<BODY onload="Init()">
<OBJECT CLASSID="clsid:09C0C400-3A0F-4CD3-8B93-8D42FCE66726" id="Gantt1"></OBJECT>

<SCRIPT LANGUAGE="VBScript">
Function Init()
	With Gantt1
		.BeginUpdate
		.Chart.PaneWidth(True) = 0
		.LinesAtRoot = -1
		With .Columns.Add("Item")
			.DisplayFilterButton = True
			.DisplayFilterPattern = False
			.Filter = "Child 1"
			.FilterType = 240
		End With
		With .Columns.Add("Date")
			.DisplayFilterButton = True
			.DisplayFilterPattern = False
			.DisplayFilterDate = True
			.FilterList = 9474 ' FilterListEnum.exShowExclude Or FilterListEnum.exShowFocusItem Or FilterListEnum.exShowCheckBox Or FilterListEnum.exNoItems
			.Filter = #12/28/2010#
			.FilterType = 4
		End With
		.FilterCriteria = "%0 or %1"
		.Description(23) = "<font ;18><fgcolor=FF0000>or</fgcolor></font>"
		.Description(11) = "<font ;18><fgcolor=FF0000>and</fgcolor></font>"
		With .Items
			h = .AddItem("Root 1")
			.CellCaption(.InsertItem(h,,"Child 1"),1) = #12/27/2010#
			.CellCaption(.InsertItem(h,,"Child 2"),1) = #12/28/2010#
			.ExpandItem(h) = True
			h = .AddItem("Root 2")
			.CellCaption(.InsertItem(h,,"Child 1"),1) = #12/29/2010#
			.CellCaption(.InsertItem(h,,"Child 2"),1) = #12/30/2010#
		End With
		.ApplyFilter
		.EndUpdate
	End With
End Function
</SCRIPT>
</BODY>
|
|
792
|
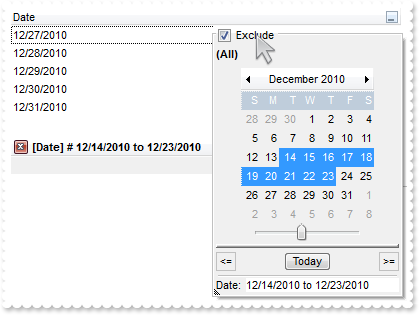
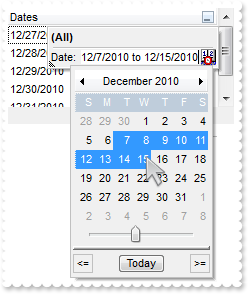
Is it possible exclude the dates being selected in the drop down filter window
<BODY onload="Init()">
<OBJECT CLASSID="clsid:09C0C400-3A0F-4CD3-8B93-8D42FCE66726" id="Gantt1"></OBJECT>

<SCRIPT LANGUAGE="VBScript">
Function Init()
	With Gantt1
		.BeginUpdate
		.Chart.PaneWidth(True) = 0
		With .Columns.Add("Date")
			.SortType = 2
			.DisplayFilterButton = True
			.DisplayFilterPattern = False
			.DisplayFilterDate = True
			.FilterList = 9474 ' FilterListEnum.exShowExclude Or FilterListEnum.exShowFocusItem Or FilterListEnum.exShowCheckBox Or FilterListEnum.exNoItems
		End With
		With .Items
			.AddItem #12/27/2010#
			.AddItem #12/28/2010#
			.AddItem #12/29/2010#
			.AddItem #12/30/2010#
			.AddItem #12/31/2010#
		End With
		.EndUpdate
	End With
End Function
</SCRIPT>
</BODY>
|
|
791
|
How can I display a calendar control inside the drop down filter window
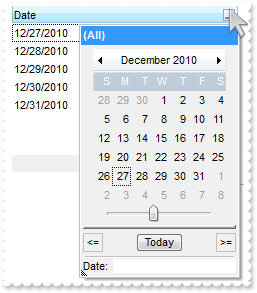
<BODY onload="Init()">
<OBJECT CLASSID="clsid:09C0C400-3A0F-4CD3-8B93-8D42FCE66726" id="Gantt1"></OBJECT>

<SCRIPT LANGUAGE="VBScript">
Function Init()
	With Gantt1
		.BeginUpdate
		.Chart.PaneWidth(True) = 0
		With .Columns.Add("Date")
			.SortType = 2
			.DisplayFilterButton = True
			.DisplayFilterPattern = False
			.DisplayFilterDate = True
			.FilterList = 1282 ' FilterListEnum.exShowFocusItem Or FilterListEnum.exShowCheckBox Or FilterListEnum.exNoItems
		End With
		With .Items
			.AddItem #12/27/2010#
			.AddItem #12/28/2010#
			.AddItem #12/29/2010#
			.AddItem #12/30/2010#
			.AddItem #12/31/2010#
		End With
		.EndUpdate
	End With
End Function
</SCRIPT>
</BODY>
|
|
790
|
Is it possible to include the dates as checkb-boxes in the drop down filter window
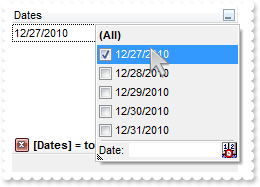
<BODY onload="Init()">
<OBJECT CLASSID="clsid:09C0C400-3A0F-4CD3-8B93-8D42FCE66726" id="Gantt1"></OBJECT>

<SCRIPT LANGUAGE="VBScript">
Function Init()
	With Gantt1
		.BeginUpdate
		.Chart.PaneWidth(True) = 0
		With .Columns.Add("Dates")
			.SortType = 2
			.DisplayFilterButton = True
			.DisplayFilterPattern = True
			.DisplayFilterDate = True
			.FilterList = 1280 ' FilterListEnum.exShowFocusItem Or FilterListEnum.exShowCheckBox
			.Filter = "to 12/27/2010"
			.FilterType = 4
		End With
		With .Items
			.AddItem #12/27/2010#
			.AddItem #12/28/2010#
			.AddItem #12/29/2010#
			.AddItem #12/30/2010#
			.AddItem #12/31/2010#
		End With
		.ApplyFilter
		.EndUpdate
	End With
End Function
</SCRIPT>
</BODY>
|
|
789
|
How can I filter items for dates before a specified date
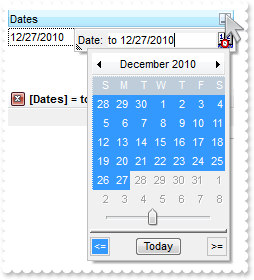
<BODY onload="Init()">
<OBJECT CLASSID="clsid:09C0C400-3A0F-4CD3-8B93-8D42FCE66726" id="Gantt1"></OBJECT>

<SCRIPT LANGUAGE="VBScript">
Function Init()
	With Gantt1
		.BeginUpdate
		.Chart.PaneWidth(True) = 0
		With .Columns.Add("Dates")
			.SortType = 2
			.DisplayFilterButton = True
			.DisplayFilterPattern = True
			.DisplayFilterDate = True
			.FilterList = 1026 ' FilterListEnum.exShowFocusItem Or FilterListEnum.exNoItems
			.Filter = "to 12/27/2010"
			.FilterType = 4
		End With
		With .Items
			.AddItem #12/27/2010#
			.AddItem #12/28/2010#
			.AddItem #12/29/2010#
			.AddItem #12/30/2010#
			.AddItem #12/31/2010#
		End With
		.ApplyFilter
		.EndUpdate
	End With
End Function
</SCRIPT>
</BODY>
|
|
788
|
Is it possible to filter dates
<BODY onload="Init()">
<OBJECT CLASSID="clsid:09C0C400-3A0F-4CD3-8B93-8D42FCE66726" id="Gantt1"></OBJECT>

<SCRIPT LANGUAGE="VBScript">
Function Init()
	With Gantt1
		.BeginUpdate
		.Chart.PaneWidth(True) = 0
		With .Columns.Add("Dates")
			.SortType = 2
			.DisplayFilterButton = True
			.DisplayFilterPattern = True
			.DisplayFilterDate = True
			.FilterList = 1026 ' FilterListEnum.exShowFocusItem Or FilterListEnum.exNoItems
		End With
		With .Items
			.AddItem #12/27/2010#
			.AddItem #12/28/2010#
			.AddItem #12/29/2010#
			.AddItem #12/30/2010#
			.AddItem #12/31/2010#
		End With
		.EndUpdate
	End With
End Function
</SCRIPT>
</BODY>
|
|
787
|
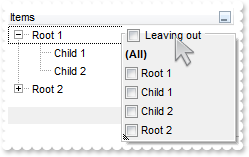
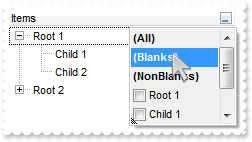
Is it possible to change the Exclude field name to something different, in the drop down filter window
<BODY onload="Init()">
<OBJECT CLASSID="clsid:09C0C400-3A0F-4CD3-8B93-8D42FCE66726" id="Gantt1"></OBJECT>

<SCRIPT LANGUAGE="VBScript">
Function Init()
	With Gantt1
		.BeginUpdate
		.Chart.PaneWidth(True) = 0
		.LinesAtRoot = -1
		.Description(25) = "Leaving out"
		With .Columns.Add("Items")
			.DisplayFilterButton = True
			.DisplayFilterPattern = False
			.FilterList = 9472 ' FilterListEnum.exShowExclude Or FilterListEnum.exShowFocusItem Or FilterListEnum.exShowCheckBox
		End With
		With .Items
			h = .AddItem("Root 1")
			.InsertItem h,,"Child 1"
			.InsertItem h,,"Child 2"
			.ExpandItem(h) = True
			h = .AddItem("Root 2")
			.InsertItem h,,"Child 1"
		End With
		.EndUpdate
	End With
End Function
</SCRIPT>
</BODY>
|
|
786
|
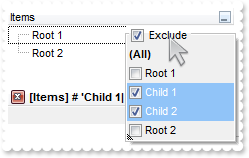
How can I display the Exclude field in the drop down filter window
<BODY onload="Init()">
<OBJECT CLASSID="clsid:09C0C400-3A0F-4CD3-8B93-8D42FCE66726" id="Gantt1"></OBJECT>

<SCRIPT LANGUAGE="VBScript">
Function Init()
	With Gantt1
		.BeginUpdate
		.Chart.PaneWidth(True) = 0
		.LinesAtRoot = -1
		With .Columns.Add("Items")
			.DisplayFilterButton = True
			.DisplayFilterPattern = False
			.FilterList = 9472 ' FilterListEnum.exShowExclude Or FilterListEnum.exShowFocusItem Or FilterListEnum.exShowCheckBox
		End With
		With .Items
			h = .AddItem("Root 1")
			.InsertItem h,,"Child 1"
			.InsertItem h,,"Child 2"
			.ExpandItem(h) = True
			h = .AddItem("Root 2")
			.InsertItem h,,"Child 1"
		End With
		.EndUpdate
	End With
End Function
</SCRIPT>
</BODY>
|
|
785
|
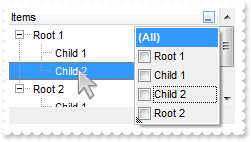
Is it possible to show and ensure the focused item from the control, in the drop down filter window
<BODY onload="Init()">
<OBJECT CLASSID="clsid:09C0C400-3A0F-4CD3-8B93-8D42FCE66726" id="Gantt1"></OBJECT>

<SCRIPT LANGUAGE="VBScript">
Function Init()
	With Gantt1
		.BeginUpdate
		.Chart.PaneWidth(True) = 0
		.LinesAtRoot = -1
		With .Columns.Add("Items")
			.DisplayFilterButton = True
			.DisplayFilterPattern = False
			.FilterList = 1280 ' FilterListEnum.exShowFocusItem Or FilterListEnum.exShowCheckBox
		End With
		With .Items
			h = .AddItem("Root 1")
			.InsertItem h,,"Child 1"
			.InsertItem h,,"Child 2"
			.ExpandItem(h) = True
			h = .AddItem("Root 2")
			.InsertItem h,,"Child 1"
			.SelectItem(.InsertItem(h,,"Child 2")) = True
			.ExpandItem(h) = True
		End With
		.EndUpdate
	End With
End Function
</SCRIPT>
</BODY>
|
|
784
|
Is it possible to show only blanks items with no listed items from the control
<BODY onload="Init()">
<OBJECT CLASSID="clsid:09C0C400-3A0F-4CD3-8B93-8D42FCE66726" id="Gantt1"></OBJECT>

<SCRIPT LANGUAGE="VBScript">
Function Init()
	With Gantt1
		.BeginUpdate
		.Chart.PaneWidth(True) = 0
		.LinesAtRoot = -1
		With .Columns.Add("Items")
			.DisplayFilterButton = True
			.DisplayFilterPattern = False
			.FilterList = 16386 ' FilterListEnum.exShowBlanks Or FilterListEnum.exNoItems
		End With
		With .Items
			h = .AddItem("Root 1")
			.InsertItem h,,"Child 1"
			.InsertItem h,,"Child 2"
			.ExpandItem(h) = True
			h = .AddItem("Root 2")
			.InsertItem h,,"Child 1"
			.InsertItem h,,"Child 2"
		End With
		.EndUpdate
	End With
End Function
</SCRIPT>
</BODY>
|
|
783
|
How can I include the blanks items in the drop down filter window
<BODY onload="Init()">
<OBJECT CLASSID="clsid:09C0C400-3A0F-4CD3-8B93-8D42FCE66726" id="Gantt1"></OBJECT>

<SCRIPT LANGUAGE="VBScript">
Function Init()
	With Gantt1
		.BeginUpdate
		.Chart.PaneWidth(True) = 0
		.LinesAtRoot = -1
		With .Columns.Add("Items")
			.DisplayFilterButton = True
			.DisplayFilterPattern = False
			.FilterList = 16640 ' FilterListEnum.exShowBlanks Or FilterListEnum.exShowCheckBox
		End With
		With .Items
			h = .AddItem("Root 1")
			.InsertItem h,,"Child 1"
			.InsertItem h,,"Child 2"
			.ExpandItem(h) = True
			h = .AddItem("Root 2")
			.InsertItem h,,"Child 1"
			.InsertItem h,,"Child 2"
		End With
		.EndUpdate
	End With
End Function
</SCRIPT>
</BODY>
|
|
782
|
How can I select multiple items in the drop down filter window, using check-boxes
<BODY onload="Init()">
<OBJECT CLASSID="clsid:09C0C400-3A0F-4CD3-8B93-8D42FCE66726" id="Gantt1"></OBJECT>

<SCRIPT LANGUAGE="VBScript">
Function Init()
	With Gantt1
		.BeginUpdate
		.Chart.PaneWidth(True) = 0
		.LinesAtRoot = -1
		With .Columns.Add("Items")
			.DisplayFilterButton = True
			.DisplayFilterPattern = False
			.FilterList = 256
		End With
		With .Items
			h = .AddItem("Root 1")
			.InsertItem h,,"Child 1"
			.InsertItem h,,"Child 2"
			.ExpandItem(h) = True
			h = .AddItem("Root 2")
			.InsertItem h,,"Child 1"
			.InsertItem h,,"Child 2"
		End With
		.EndUpdate
	End With
End Function
</SCRIPT>
</BODY>
|
|
781
|
Is it possible to allow a single item being selected in the drop down filter window
<BODY onload="Init()">
<OBJECT CLASSID="clsid:09C0C400-3A0F-4CD3-8B93-8D42FCE66726" id="Gantt1"></OBJECT>

<SCRIPT LANGUAGE="VBScript">
Function Init()
	With Gantt1
		.BeginUpdate
		.Chart.PaneWidth(True) = 0
		.LinesAtRoot = -1
		With .Columns.Add("Items")
			.DisplayFilterButton = True
			.DisplayFilterPattern = False
			.FilterList = 128
		End With
		With .Items
			h = .AddItem("Root 1")
			.InsertItem h,,"Child 1"
			.InsertItem h,,"Child 2"
			.ExpandItem(h) = True
			h = .AddItem("Root 2")
			.InsertItem h,,"Child 1"
			.InsertItem h,,"Child 2"
		End With
		.EndUpdate
	End With
End Function
</SCRIPT>
</BODY>
|
|
780
|
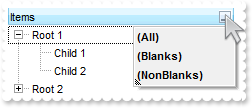
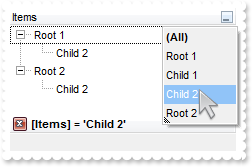
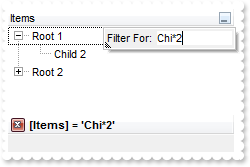
How can I display no (All) item in the drop down filter window
<BODY onload="Init()">
<OBJECT CLASSID="clsid:09C0C400-3A0F-4CD3-8B93-8D42FCE66726" id="Gantt1"></OBJECT>

<SCRIPT LANGUAGE="VBScript">
Function Init()
	With Gantt1
		.BeginUpdate
		.Chart.PaneWidth(True) = 0
		.LinesAtRoot = -1
		.Description(0) = ""
		With .Columns.Add("Items")
			.DisplayFilterButton = True
			.DisplayFilterPattern = True
			.FilterList = 2
		End With
		With .Items
			h = .AddItem("Root 1")
			.InsertItem h,,"Child 1"
			.InsertItem h,,"Child 2"
			.ExpandItem(h) = True
			h = .AddItem("Root 2")
			.InsertItem h,,"Child 1"
			.InsertItem h,,"Child 2"
		End With
		.EndUpdate
	End With
End Function
</SCRIPT>
</BODY>
|
|
779
|
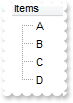
Is it possible to display no items in the drop down filter window, so only the pattern is visible
<BODY onload="Init()">
<OBJECT CLASSID="clsid:09C0C400-3A0F-4CD3-8B93-8D42FCE66726" id="Gantt1"></OBJECT>

<SCRIPT LANGUAGE="VBScript">
Function Init()
	With Gantt1
		.BeginUpdate
		.Chart.PaneWidth(True) = 0
		.LinesAtRoot = -1
		With .Columns.Add("Items")
			.DisplayFilterButton = True
			.DisplayFilterPattern = True
			.FilterList = 2
		End With
		With .Items
			h = .AddItem("Root 1")
			.InsertItem h,,"Child 1"
			.InsertItem h,,"Child 2"
			.ExpandItem(h) = True
			h = .AddItem("Root 2")
			.InsertItem h,,"Child 1"
			.InsertItem h,,"Child 2"
		End With
		.EndUpdate
	End With
End Function
</SCRIPT>
</BODY>
|
|
778
|
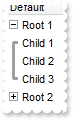
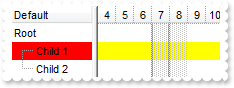
How can I show the child items with no identation
<BODY onload="Init()">
<OBJECT CLASSID="clsid:09C0C400-3A0F-4CD3-8B93-8D42FCE66726" id="Gantt1"></OBJECT>

<SCRIPT LANGUAGE="VBScript">
Function Init()
	With Gantt1
		.LinesAtRoot = 5
		.Indent = 12
		.HasLines = 2
		.Columns.Add "Default"
		With .Items
			h = .AddItem("Root 1")
			.InsertItem h,,"Child 1"
			.InsertItem h,,"Child 2"
			.InsertItem h,,"Child 3"
			.ExpandItem(h) = True
			h = .AddItem("Root 2")
			.InsertItem h,,"Child 1"
			.InsertItem h,,"Child 2"
			.InsertItem h,,"Child 3"
		End With
	End With
End Function
</SCRIPT>
</BODY>
|
|
777
|
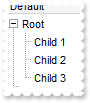
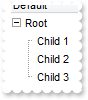
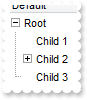
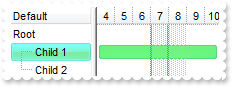
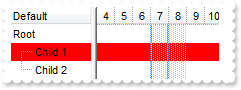
Is there other ways of showing the hierarchy lines (exGroupLinesAtRoot)
<BODY onload="Init()">
<OBJECT CLASSID="clsid:09C0C400-3A0F-4CD3-8B93-8D42FCE66726" id="Gantt1"></OBJECT>

<SCRIPT LANGUAGE="VBScript">
Function Init()
	With Gantt1
		.LinesAtRoot = 1
		.Indent = 12
		.Columns.Add "Default"
		With .Items
			h = .AddItem("Root")
			.InsertItem h,,"Child 1"
			.InsertItem h,,"Child 2"
			.InsertItem h,,"Child 3"
			.ExpandItem(h) = True
		End With
	End With
End Function
</SCRIPT>
</BODY>
|
|
776
|
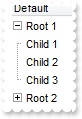
Is there other ways of showing the hierarchy lines (exGroupLinesOutside)
<BODY onload="Init()">
<OBJECT CLASSID="clsid:09C0C400-3A0F-4CD3-8B93-8D42FCE66726" id="Gantt1"></OBJECT>

<SCRIPT LANGUAGE="VBScript">
Function Init()
	With Gantt1
		.LinesAtRoot = 5
		.Indent = 12
		.Columns.Add "Default"
		With .Items
			h = .AddItem("Root 1")
			.InsertItem h,,"Child 1"
			.InsertItem h,,"Child 2"
			.InsertItem h,,"Child 3"
			.ExpandItem(h) = True
			h = .AddItem("Root 2")
			.InsertItem h,,"Child 1"
			.InsertItem h,,"Child 2"
			.InsertItem h,,"Child 3"
		End With
	End With
End Function
</SCRIPT>
</BODY>
|
|
775
|
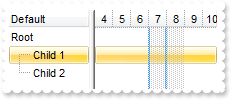
Is there other ways of showing the hierarchy lines (exGroupLinesInsideLeaf)
<BODY onload="Init()">
<OBJECT CLASSID="clsid:09C0C400-3A0F-4CD3-8B93-8D42FCE66726" id="Gantt1"></OBJECT>

<SCRIPT LANGUAGE="VBScript">
Function Init()
	With Gantt1
		.LinesAtRoot = 4
		.Indent = 12
		.Columns.Add "Default"
		With .Items
			h = .AddItem("Root")
			.InsertItem h,,"Child 1"
			.InsertItem h,,"Child 2"
			.InsertItem h,,"Child 3"
			.ExpandItem(h) = True
		End With
	End With
End Function
</SCRIPT>
</BODY>
|
|
774
|
Is there other ways of showing the hierarchy lines (exGroupLinesInside)

<BODY onload="Init()">
<OBJECT CLASSID="clsid:09C0C400-3A0F-4CD3-8B93-8D42FCE66726" id="Gantt1"></OBJECT>

<SCRIPT LANGUAGE="VBScript">
Function Init()
	With Gantt1
		.LinesAtRoot = 3
		.Indent = 12
		.Columns.Add "Default"
		With .Items
			h = .AddItem("Root")
			.InsertItem h,,"Child 1"
			.InsertItem h,,"Child 2"
			.InsertItem h,,"Child 3"
			.ExpandItem(h) = True
		End With
	End With
End Function
</SCRIPT>
</BODY>
|
|
773
|
Is there other ways of showing the hierarchy lines (exGroupLines)
<BODY onload="Init()">
<OBJECT CLASSID="clsid:09C0C400-3A0F-4CD3-8B93-8D42FCE66726" id="Gantt1"></OBJECT>

<SCRIPT LANGUAGE="VBScript">
Function Init()
	With Gantt1
		.LinesAtRoot = 2
		.Indent = 12
		.Columns.Add "Default"
		With .Items
			h = .AddItem("Root")
			.InsertItem h,,"Child 1"
			.InsertItem .InsertItem(h,,"Child 2"),,"SubChild 2"
			.InsertItem h,,"Child 3"
			.ExpandItem(h) = True
		End With
	End With
End Function
</SCRIPT>
</BODY>
|
|
772
|
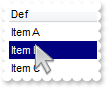
Is it possible background color displayed when the mouse passes over an item
<BODY onload="Init()">
<OBJECT CLASSID="clsid:09C0C400-3A0F-4CD3-8B93-8D42FCE66726" id="Gantt1"></OBJECT>

<SCRIPT LANGUAGE="VBScript">
Function Init()
	With Gantt1
		.BeginUpdate
		.Columns.Add "Def"
		.HotBackColor = RGB(0,0,128)
		.HotForeColor = RGB(255,255,255)
		With .Items
			.AddItem "Item A"
			.AddItem "Item B"
			.AddItem "Item C"
		End With
		.EndUpdate
	End With
End Function
</SCRIPT>
</BODY>
|
|
771
|
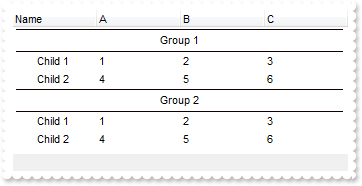
How can I simulate displaying groups
<BODY onload="Init()">
<OBJECT CLASSID="clsid:09C0C400-3A0F-4CD3-8B93-8D42FCE66726" id="Gantt1"></OBJECT>

<SCRIPT LANGUAGE="VBScript">
Function Init()
	With Gantt1
		.HasLines = 0
		.ScrollBySingleLine = True
		.Chart.PaneWidth(True) = 0
		With .Columns
			.Add "Name"
			.Add "A"
			.Add "B"
			.Add "C"
		End With
		With .Items
			h = .AddItem("Group 1")
			.CellHAlignment(h,0) = 1
			.ItemDivider(h) = 0
			.ItemDividerLineAlignment(h) = 3
			.ItemHeight(h) = 24
			.SortableItem(h) = False
			h1 = .InsertItem(h,,"Child 1")
			.CellCaption(h1,1) = 1
			.CellCaption(h1,2) = 2
			.CellCaption(h1,3) = 3
			h1 = .InsertItem(h,,"Child 2")
			.CellCaption(h1,1) = 4
			.CellCaption(h1,2) = 5
			.CellCaption(h1,3) = 6
			.ExpandItem(h) = True
			h = .AddItem("Group 2")
			.CellHAlignment(h,0) = 1
			.ItemDivider(h) = 0
			.ItemDividerLineAlignment(h) = 3
			.ItemHeight(h) = 24
			.SortableItem(h) = False
			h1 = .InsertItem(h,,"Child 1")
			.CellCaption(h1,1) = 1
			.CellCaption(h1,2) = 2
			.CellCaption(h1,3) = 3
			h1 = .InsertItem(h,,"Child 2")
			.CellCaption(h1,1) = 4
			.CellCaption(h1,2) = 5
			.CellCaption(h1,3) = 6
			.ExpandItem(h) = True
		End With
	End With
End Function
</SCRIPT>
</BODY>
|
|
770
|
Is it possible to change the height for all items at once
<BODY onload="Init()">
<OBJECT CLASSID="clsid:09C0C400-3A0F-4CD3-8B93-8D42FCE66726" id="Gantt1"></OBJECT>

<SCRIPT LANGUAGE="VBScript">
Function Init()
	With Gantt1
		.BeginUpdate
		.LinesAtRoot = -1
		.Columns.Add "Items"
		With .Items
			h = .AddItem("Root 1")
			.InsertItem h,,"Child 1"
			.InsertItem h,,"Child 2"
			h = .AddItem("Root 2")
			.InsertItem h,,"Child 1"
			.InsertItem h,,"Child 2"
			.ExpandItem(0) = True
		End With
		.EndUpdate
		.DefaultItemHeight = 12
		.Items.ItemHeight(0) = 12
	End With
End Function
</SCRIPT>
</BODY>
|
|
769
|
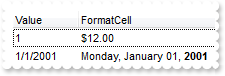
Is it possible to specify the cell's value but still want to display some formatted text instead the value
<BODY onload="Init()">
<OBJECT CLASSID="clsid:09C0C400-3A0F-4CD3-8B93-8D42FCE66726" id="Gantt1"></OBJECT>

<SCRIPT LANGUAGE="VBScript">
Function Init()
	With Gantt1
		.BeginUpdate
		.Chart.PaneWidth(True) = 0
		.Columns.Add "Value"
		.Columns.Add "FormatCell"
		With .Items
			h = .AddItem(1)
			.CellCaption(h,1) = 12
			.FormatCell(h,1) = "currency(value)"
			h = .AddItem(#1/1/2001#)
			.CellCaption(h,1) = #1/1/2001#
			.CellCaptionFormat(h,1) = 1
			.FormatCell(h,1) = "longdate(value) replace '2001' with '<b>2001</b>'"
		End With
		.EndUpdate
	End With
End Function
</SCRIPT>
</BODY>
|
|
768
|
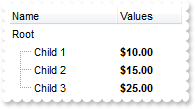
Is it possible to specify the cell's value but still want to display some formatted text instead the value
<BODY onload="Init()">
<OBJECT CLASSID="clsid:09C0C400-3A0F-4CD3-8B93-8D42FCE66726" id="Gantt1"></OBJECT>

<SCRIPT LANGUAGE="VBScript">
Function Init()
	With Gantt1
		.BeginUpdate
		.Chart.PaneWidth(True) = 0
		.MarkSearchColumn = False
		With .Columns
			.Add "Name"
			With .Add("Values")
				.SortType = 1
				.AllowSizing = False
				.Width = 64
				.FormatColumn = "((0:=dbl(value)) < 10? '<fgcolor=808080><font ;7>' :'<b>') + currency(=:0)"
				.Def(17) = 1
			End With
		End With
		With .Items
			h = .AddItem("Root")
			.FormatCell(h,1) = "'<none>'"
			.CellCaption(.InsertItem(h,,"Child 1"),1) = 10
			.CellCaption(.InsertItem(h,,"Child 2"),1) = 15
			.CellCaption(.InsertItem(h,,"Child 3"),1) = 25
			.ExpandItem(h) = True
		End With
		.EndUpdate
	End With
End Function
</SCRIPT>
</BODY>
|
|
767
|
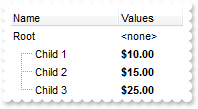
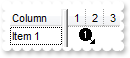
I am using the FormatColumn to display the current currency, but would like hide some values. Is it possible
<BODY onload="Init()">
<OBJECT CLASSID="clsid:09C0C400-3A0F-4CD3-8B93-8D42FCE66726" id="Gantt1"></OBJECT>

<SCRIPT LANGUAGE="VBScript">
Function Init()
	With Gantt1
		.BeginUpdate
		.Chart.PaneWidth(True) = 0
		.MarkSearchColumn = False
		With .Columns
			.Add "Name"
			With .Add("Values")
				.SortType = 1
				.AllowSizing = False
				.Width = 64
				.FormatColumn = "((0:=dbl(value)) < 10? '<fgcolor=808080><font ;7>' :'<b>') + currency(=:0)"
				.Def(17) = 1
			End With
		End With
		With .Items
			h = .AddItem("Root")
			.FormatCell(h,1) = " "
			.CellCaption(.InsertItem(h,,"Child 1"),1) = 10
			.CellCaption(.InsertItem(h,,"Child 2"),1) = 15
			.CellCaption(.InsertItem(h,,"Child 3"),1) = 25
			.ExpandItem(h) = True
		End With
		.EndUpdate
	End With
End Function
</SCRIPT>
</BODY>
|
|
766
|
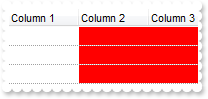
How can I apply the same ConditionalFormat on more than 1(one) column (multiple columns and not on item)
<BODY onload="Init()">
<OBJECT CLASSID="clsid:09C0C400-3A0F-4CD3-8B93-8D42FCE66726" id="Gantt1"></OBJECT>

<SCRIPT LANGUAGE="VBScript">
Function Init()
	With Gantt1
		.BeginUpdate
		With .ConditionalFormats.Add("1","K1")
			.BackColor = RGB(255,0,0)
			.ApplyTo = 1 ' &H1
		End With
		With .ConditionalFormats.Add("1","K2")
			.BackColor = RGB(255,0,0)
			.ApplyTo = 2 ' &H2
		End With
		.MarkSearchColumn = False
		.DrawGridLines = -2
		With .Columns
			.Add "Column 1"
			.Add "Column 2"
			.Add "Column 3"
		End With
		With .Items
			.AddItem
			.AddItem
			.AddItem
		End With
		.EndUpdate
	End With
End Function
</SCRIPT>
</BODY>
|
|
765
|
How can I get the list of items as they are displayed
<BODY onload="Init()">
<OBJECT CLASSID="clsid:09C0C400-3A0F-4CD3-8B93-8D42FCE66726" id="Gantt1"></OBJECT>
<SCRIPT LANGUAGE="VBScript">
Function Init()
With Gantt1
.BeginUpdate
.BackColorAlternate = RGB(240,240,240)
.Columns.Add "Names"
With .Items
.AddItem "Mantel"
.AddItem "Mechanik"
.AddItem "Motor"
.AddItem "Murks"
.AddItem "M�rchen"
.AddItem "M�hren"
.AddItem "M�hle"
End With
.Columns.Item(0).SortOrder = 1
.EndUpdate
alert( .GetItems(1) )
End With
End Function
</SCRIPT>
</BODY>
|
|
764
|
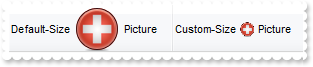
Is posible to reduce the size of the picture to be shown in the column's caption
<BODY onload="Init()">
<OBJECT CLASSID="clsid:09C0C400-3A0F-4CD3-8B93-8D42FCE66726" id="Gantt1"></OBJECT>

<SCRIPT LANGUAGE="VBScript">
Function Init()
	With Gantt1
		.BeginUpdate
		.HTMLPicture("pic1") = "c:\exontrol\images\zipdisk.gif"
		.HeaderHeight = 48
		.Columns.Add("DefaultSize").HTMLCaption = "Default-Size <img>pic1</img> Picture"
		.Columns.Add("CustomSize").HTMLCaption = "Custom-Size <img>pic1:16</img> Picture"
		.EndUpdate
	End With
End Function
</SCRIPT>
</BODY>
|
|
763
|
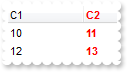
How can I change the color, font, bold etc for the items/cells in the same column or for the entire column
<BODY onload="Init()">
<OBJECT CLASSID="clsid:09C0C400-3A0F-4CD3-8B93-8D42FCE66726" id="Gantt1"></OBJECT>

<SCRIPT LANGUAGE="VBScript">
Function Init()
	With Gantt1
		.BeginUpdate
		.MarkSearchColumn = False
		With .ConditionalFormats.Add("1")
			.Bold = True
			.ForeColor = RGB(255,0,0)
			.ApplyTo = 1 ' &H1
		End With
		.Columns.Add "C1"
		With .Columns.Add("C2")
			.HeaderBold = True
			.HTMLCaption = "<fgcolor=FF0000>C2"
		End With
		With .Items
			.CellCaption(.AddItem(10),1) = 11
			.CellCaption(.AddItem(12),1) = 13
		End With
		.EndUpdate
	End With
End Function
</SCRIPT>
</BODY>
|
|
762
|
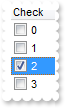
The item is not getting selected when clicking the cell's checkbox. What should I do
<BODY onload="Init()">
<SCRIPT LANGUAGE="VBScript">
Function Gantt1_CellStateChanged(Item, ColIndex)
	With Gantt1
		.Items.SelectItem(Item) = True
	End With
End Function
</SCRIPT>

<OBJECT CLASSID="clsid:09C0C400-3A0F-4CD3-8B93-8D42FCE66726" id="Gantt1"></OBJECT>

<SCRIPT LANGUAGE="VBScript">
Function Init()
	With Gantt1
		.Columns.Add("Check").Def(0) = True
		With .Items
			.AddItem 0
			.AddItem 1
			.AddItem 2
			.AddItem 3
		End With
	End With
End Function
</SCRIPT>
</BODY>
|
|
761
|
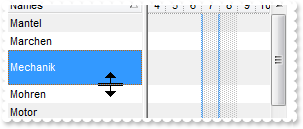
Is it possible to limit the height of the item while resizing
<BODY onload="Init()">
<SCRIPT LANGUAGE="VBScript">
Function Gantt1_AddItem(Item)
With Gantt1
.Items.ItemMinHeight(Item) = 18
.Items.ItemMaxHeight(Item) = 72
End With
End Function
</SCRIPT>
<OBJECT CLASSID="clsid:09C0C400-3A0F-4CD3-8B93-8D42FCE66726" id="Gantt1"></OBJECT>
<SCRIPT LANGUAGE="VBScript">
Function Init()
With Gantt1
.BeginUpdate
.ItemsAllowSizing = -1
.ScrollBySingleLine = False
.BackColorAlternate = RGB(240,240,240)
.Columns.Add "Names"
With .Items
.AddItem "Mantel"
.AddItem "Mechanik"
.AddItem "Motor"
.AddItem "Murks"
.AddItem "M�rchen"
.AddItem "M�hren"
.AddItem "M�hle"
End With
.Columns.Item(0).SortOrder = 1
.EndUpdate
End With
End Function
</SCRIPT>
</BODY>
|
|
760
|
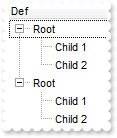
Is it possible to copy the hierarchy of the control using the GetItems method
<BODY onload="Init()">
<OBJECT CLASSID="clsid:09C0C400-3A0F-4CD3-8B93-8D42FCE66726" id="Gantt1"></OBJECT>

<SCRIPT LANGUAGE="VBScript">
Function Init()
	With Gantt1
		.LinesAtRoot = -1
		.Columns.Add "Def"
		With .Items
			h = .AddItem("Root")
			.InsertItem h,,"Child 1"
			.InsertItem h,,"Child 2"
		End With
		.PutItems .GetItems(-1)
	End With
End Function
</SCRIPT>
</BODY>
|
|
759
|
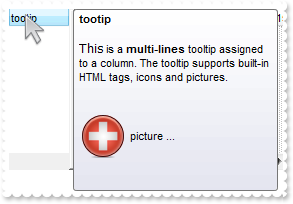
Does your control supports multiple lines tooltip
<BODY onload="Init()">
<OBJECT CLASSID="clsid:09C0C400-3A0F-4CD3-8B93-8D42FCE66726" id="Gantt1"></OBJECT>

<SCRIPT LANGUAGE="VBScript">
Function Init()
	With Gantt1
		.HTMLPicture("pic1") = "c:\exontrol\images\zipdisk.gif"
		.ToolTipDelay = 1
		.Columns.Add("tootip").ToolTip = "<br><font Tahoma;10>This</font> is a <b>multi-lines</b> tooltip assigned to a column. The tooltip supports built-in HTML tags, " & _
		"icons and pictures.<br><br><br><img>pic1</img> picture ... <br><br>"
	End With
End Function
</SCRIPT>
</BODY>
|
|
758
|
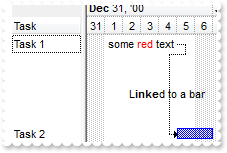
It is possible to write the word in red/color or to add a tooltip or a link to the word
<BODY onload="Init()">
<OBJECT CLASSID="clsid:09C0C400-3A0F-4CD3-8B93-8D42FCE66726" id="Gantt1"></OBJECT>

<SCRIPT LANGUAGE="VBScript">
Function Init()
	With Gantt1
		.Columns.Add "Task"
		With .Chart
			.LevelCount = 2
			.FirstVisibleDate = #12/26/2000#
			.PaneWidth(False) = 32
		End With
		With .Items
			h1 = .AddItem("Task 1")
			.AddBar h1,"",#1/1/2001#,#1/5/2001#,"K1","some <fgcolor=FF0000>red</fgcolor> text"
			.ItemBar(h1,"K1",10) = False
			.ItemBar(h1,"K1",6) = "And here goes the <b>tooltip</b> of the text. "
			.AddItem ""
			.AddItem ""
			.AddItem ""
			.AddItem ""
			h2 = .AddItem("Task 2")
			.AddBar h2,"Task",#1/5/2001#,#1/7/2001#,"K2"
			.ItemBar(h2,"K2",6) = "And here goes the <b>tooltip</b> of the bar. "
			.AddLink "L1",h1,"K1",h2,"K2"
			.Link("L1",12) = "L<b>inke</b>d to a bar"
			.Link("L1",13) = "And here goes the <b>tooltip</b> of the link. "
		End With
	End With
End Function
</SCRIPT>
</BODY>
|
|
757
|
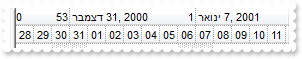
It is possible to use seconds/minutes/hours as time scale in your control, but using my regional settings
<BODY onload="Init()">
<OBJECT CLASSID="clsid:09C0C400-3A0F-4CD3-8B93-8D42FCE66726" id="Gantt1"></OBJECT>

<SCRIPT LANGUAGE="VBScript">
Function Init()
	With Gantt1
		.BeginUpdate
		With .Chart
			.Label(16) = "<|><%loc_m1%><|><%loc_m2%><|><%loc_m3%><|><%loc_mmmm%><|><%loc_m3%> '<%yy%><|><%loc_mmmm%> <%yyyy%>"
			.Label(256) = "<|><%ww%><|><%loc_m3%> <%d%>, '<%yy%><r><%ww%><|><%loc_mmmm%> <%d%>, <%yyyy%><r><%ww%><||><||>256"
			.Label(4096) = "<|><%loc_d1%><|><%loc_d2%><|><%loc_d3%><|><%loc_dddd%><|><%loc_d3%>, <%loc_m3%> <%d%>, '<%yy%><|><%loc_dddd%>, <%loc_mmmm%> <%d" & _
		"%>, <%yyyy%><||><||>4096"
			.Label(65536) = "<|><%hh%><|><%h%> <%AM/PM%><|><%loc_d3%>, <%loc_m3%> <%d%>, '<%yy%> <%h%> <%AM/PM%><|><%loc_dddd%>, <%loc_mmmm%> <%d%>, <%yyyy%" & _
		"> <%h%> <%AM/PM%><||><||>65536"
			.Label(1048576) = "<|><%nn%><|><%h%>:<%nn%> <%AM/PM%><|><%loc_d3%>, <%loc_m3%> <%d%>, '<%yy%> <%h%>:<%nn%> <%AM/PM%><|><%loc_dddd%>, <%loc_mmmm%> " & _
		"<%d%>, <%yyyy%> <%h%>:<%nn%> <%AM/PM%>"
			.Label(16777216) = "<|><%ss%><|><%nn%>:<%ss%><|><%h%>:<%nn%>:<%ss%> <%AM/PM%><|><%loc_d3%>, <%loc_m3%> <%d%>, '<%yy%> <%h%>:<%nn%>:<%ss%> <%AM/PM%>" & _
		"<|><%loc_dddd%>, <%loc_mmmm%> <%d%>, <%yyyy%> <%h%>:<%nn%>:<%ss%> <%AM/PM%>"
			.LabelToolTip(16) = "<%loc_mmmm%>/<%yyyy%>"
			.LabelToolTip(256) = "<%loc_mmmm%> <%d%>, <%yyyy%> <%ww%>"
			.LabelToolTip(4096) = "<%loc_dddd%>, <%loc_mmmm%> <%d%>, <%yyyy%>"
			.LabelToolTip(65536) = "<%loc_dddd%>, <%loc_mmmm%> <%d%>, <%yyyy%> <%h%> <%AM/PM%>"
			.LabelToolTip(1048576) = "<%loc_dddd%>, <%loc_mmmm%> <%d%>, <%yyyy%> <%h%>:<%nn%> <%AM/PM%>"
			.LabelToolTip(16777216) = "<%loc_dddd%>, <%loc_mmmm%> <%d%>, <%yyyy%> <%h%>:<%nn%>:<%ss%> <%AM/PM%>"
		End With
		With .Chart
			.PaneWidth(False) = 0
			.FirstVisibleDate = #1/1/2001#
			.LevelCount = 4
			.Level(0).Label = 4096
			.Level(1).Label = 65536
			.Level(2).Label = 1048576
			With .Level(3)
				.Count = 15
				.Label = 16777216
			End With
		End With
		.EndUpdate
	End With
End Function
</SCRIPT>
</BODY>
|
|
756
|
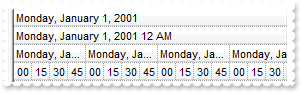
The chart's header is displayed in English. Can I change so it is the same as in my regional settings
<BODY onload="Init()">
<OBJECT CLASSID="clsid:09C0C400-3A0F-4CD3-8B93-8D42FCE66726" id="Gantt1"></OBJECT>

<SCRIPT LANGUAGE="VBScript">
Function Init()
	With Gantt1
		.BeginUpdate
		With .Chart
			.Label(16) = "<|><%loc_m1%><|><%loc_m2%><|><%loc_m3%><|><%loc_mmmm%><|><%loc_m3%> '<%yy%><|><%loc_mmmm%> <%yyyy%>"
			.Label(256) = "<|><%ww%><|><%loc_m3%> <%d%>, '<%yy%><r><%ww%><|><%loc_mmmm%> <%d%>, <%yyyy%><r><%ww%><||><||>256"
			.Label(4096) = "<|><%loc_d1%><|><%loc_d2%><|><%loc_d3%><|><%loc_dddd%><|><%loc_d3%>, <%loc_m3%> <%d%>, '<%yy%><|><%loc_dddd%>, <%loc_mmmm%> <%d" & _
		"%>, <%yyyy%><||><||>4096"
			.Label(65536) = "<|><%hh%><|><%h%> <%AM/PM%><|><%loc_d3%>, <%loc_m3%> <%d%>, '<%yy%> <%h%> <%AM/PM%><|><%loc_dddd%>, <%loc_mmmm%> <%d%>, <%yyyy%" & _
		"> <%h%> <%AM/PM%><||><||>65536"
			.Label(1048576) = "<|><%nn%><|><%h%>:<%nn%> <%AM/PM%><|><%loc_d3%>, <%loc_m3%> <%d%>, '<%yy%> <%h%>:<%nn%> <%AM/PM%><|><%loc_dddd%>, <%loc_mmmm%> " & _
		"<%d%>, <%yyyy%> <%h%>:<%nn%> <%AM/PM%>"
			.Label(16777216) = "<|><%ss%><|><%nn%>:<%ss%><|><%h%>:<%nn%>:<%ss%> <%AM/PM%><|><%loc_d3%>, <%loc_m3%> <%d%>, '<%yy%> <%h%>:<%nn%>:<%ss%> <%AM/PM%>" & _
		"<|><%loc_dddd%>, <%loc_mmmm%> <%d%>, <%yyyy%> <%h%>:<%nn%>:<%ss%> <%AM/PM%>"
			.LabelToolTip(16) = "<%loc_mmmm%>/<%yyyy%>"
			.LabelToolTip(256) = "<%loc_mmmm%> <%d%>, <%yyyy%> <%ww%>"
			.LabelToolTip(4096) = "<%loc_dddd%>, <%loc_mmmm%> <%d%>, <%yyyy%>"
			.LabelToolTip(65536) = "<%loc_dddd%>, <%loc_mmmm%> <%d%>, <%yyyy%> <%h%> <%AM/PM%>"
			.LabelToolTip(1048576) = "<%loc_dddd%>, <%loc_mmmm%> <%d%>, <%yyyy%> <%h%>:<%nn%> <%AM/PM%>"
			.LabelToolTip(16777216) = "<%loc_dddd%>, <%loc_mmmm%> <%d%>, <%yyyy%> <%h%>:<%nn%>:<%ss%> <%AM/PM%>"
		End With
		With .Chart
			.PaneWidth(False) = 0
			.FirstVisibleDate = #1/1/2001#
			.LevelCount = 2
			.UnitScale = 4096
		End With
		.EndUpdate
	End With
End Function
</SCRIPT>
</BODY>
|
|
755
|
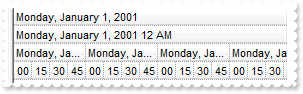
It is possible to use seconds/minutes/hours as time scale in your control
<BODY onload="Init()">
<OBJECT CLASSID="clsid:09C0C400-3A0F-4CD3-8B93-8D42FCE66726" id="Gantt1"></OBJECT>

<SCRIPT LANGUAGE="VBScript">
Function Init()
	With Gantt1
		.BeginUpdate
		With .Chart
			.PaneWidth(False) = 0
			.FirstVisibleDate = #1/1/2001#
			.LevelCount = 4
			.Level(0).Label = 4096
			.Level(1).Label = 65536
			.Level(2).Label = 1048576
			With .Level(3)
				.Count = 15
				.Label = 16777216
			End With
		End With
		.EndUpdate
	End With
End Function
</SCRIPT>
</BODY>
|
|
754
|
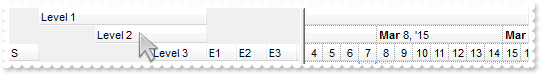
How can I prevent highlighting the column from the cursor - point
<BODY onload="Init()">
<OBJECT CLASSID="clsid:09C0C400-3A0F-4CD3-8B93-8D42FCE66726" id="Gantt1"></OBJECT>

<SCRIPT LANGUAGE="VBScript">
Function Init()
	With Gantt1
		.VisualAppearance.Add 1,"gBFLBCJwBAEHhEJAEGg4BI0IQAAYAQGKIYBkAKBQAGaAoDDUOQzQwAAxDKKUEwsACEIrjKCYVgOHYYRrIMYgBCMJhLEoaZLhEZRQiqDYtRDFQBSDDcPw/EaRZohGaYJ" & _
		"gEgI="
		.Background(32) = &H1000000
		.Columns.Add("S").Width = 32
		.Columns.Add("Level 1").LevelKey = 1
		.Columns.Add("Level 2").LevelKey = 1
		.Columns.Add("Level 3").LevelKey = 1
		.Columns.Add("E1").Width = 32
		.Columns.Add("E2").Width = 32
		.Columns.Add("E3").Width = 32
		.Columns.Add("E4").Width = 32
	End With
End Function
</SCRIPT>
</BODY>
|
|
753
|
Can I use and display PNG pictures
<BODY onload="Init()">
<OBJECT CLASSID="clsid:09C0C400-3A0F-4CD3-8B93-8D42FCE66726" id="Gantt1"></OBJECT>

<SCRIPT LANGUAGE="VBScript">
Function Init()
	With Gantt1
		.HTMLPicture("pic1") = "c:\exontrol\images\card.png"
		.HeaderHeight = 48
		.Columns.Add("ColumnName").HTMLCaption = "<b>HTML</b> Column <img>pic1</img> Picture"
	End With
End Function
</SCRIPT>
</BODY>
|
|
752
|
Is it possible to specify the background color for the item in the chart part only
<BODY onload="Init()">
<OBJECT CLASSID="clsid:09C0C400-3A0F-4CD3-8B93-8D42FCE66726" id="Gantt1"></OBJECT>

<SCRIPT LANGUAGE="VBScript">
Function Init()
	With Gantt1
		.Columns.Add "Default"
		With .Items
			h = .AddItem("Root")
			hC = .InsertItem(h,,"Child 1")
			Gantt1.Chart.ItemBackColor(hC) = RGB(255,0,0)
			.InsertItem h,,"Child 2"
			.ExpandItem(h) = True
		End With
	End With
End Function
</SCRIPT>
</BODY>
|
|
751
|
Is it possible to apply different visual appearance, color, sizes for item in the list and chart part
<BODY onload="Init()">
<OBJECT CLASSID="clsid:09C0C400-3A0F-4CD3-8B93-8D42FCE66726" id="Gantt1"></OBJECT>

<SCRIPT LANGUAGE="VBScript">
Function Init()
	With Gantt1
		.VisualAppearance.Add 1,"c:\exontrol\images\normal.ebn"
		.VisualAppearance.Add 2,"c:\exontrol\images\pushed.ebn"
		.VisualAppearance.Add 3,"CP:2 2 2 -2 -2"
		.Columns.Add "Default"
		.SelBackMode = 1
		With .Items
			h = .AddItem("Root")
			hC = .InsertItem(h,,"Child 1")
			.ItemBackColor(hC) = &H1ffff00
			Gantt1.Chart.ItemBackColor(hC) = &H300ff00
			.InsertItem h,,"Child 2"
			.ExpandItem(h) = True
		End With
	End With
End Function
</SCRIPT>
</BODY>
|
|
750
|
How do I change the visual appearance for the entire item, using your EBN technology
<BODY onload="Init()">
<OBJECT CLASSID="clsid:09C0C400-3A0F-4CD3-8B93-8D42FCE66726" id="Gantt1"></OBJECT>

<SCRIPT LANGUAGE="VBScript">
Function Init()
	With Gantt1
		.VisualAppearance.Add 1,"c:\exontrol\images\normal.ebn"
		.Columns.Add "Default"
		With .Items
			h = .AddItem("Root")
			hC = .InsertItem(h,,"Child 1")
			.ItemBackColor(hC) = &H1000000
			Gantt1.Chart.ItemBackColor(hC) = &H1000000
			.InsertItem h,,"Child 2"
			.ExpandItem(h) = True
		End With
	End With
End Function
</SCRIPT>
</BODY>
|
|
749
|
is it possible to specify the a different background color for the item, list and chart part
<BODY onload="Init()">
<OBJECT CLASSID="clsid:09C0C400-3A0F-4CD3-8B93-8D42FCE66726" id="Gantt1"></OBJECT>

<SCRIPT LANGUAGE="VBScript">
Function Init()
	With Gantt1
		.Columns.Add "Default"
		With .Items
			h = .AddItem("Root")
			hC = .InsertItem(h,,"Child 1")
			.ItemBackColor(hC) = RGB(255,0,0)
			Gantt1.Chart.ItemBackColor(hC) = RGB(255,255,0)
			.InsertItem h,,"Child 2"
			.ExpandItem(h) = True
		End With
	End With
End Function
</SCRIPT>
</BODY>
|
|
748
|
Is it possible to specify the background color for the entire row, including the chart part
<BODY onload="Init()">
<OBJECT CLASSID="clsid:09C0C400-3A0F-4CD3-8B93-8D42FCE66726" id="Gantt1"></OBJECT>

<SCRIPT LANGUAGE="VBScript">
Function Init()
	With Gantt1
		.Columns.Add "Default"
		With .Items
			h = .AddItem("Root")
			hC = .InsertItem(h,,"Child 1")
			.ItemBackColor(hC) = RGB(255,0,0)
			Gantt1.Chart.ItemBackColor(hC) = RGB(255,0,0)
			.InsertItem h,,"Child 2"
			.ExpandItem(h) = True
		End With
	End With
End Function
</SCRIPT>
</BODY>
|
|
747
|
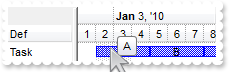
How can I show the tooltip programmatically ( I want to be able to set the tooltip content dynamically just before the tooltip start to appear, not using the exBarTooltip )
<BODY onload="Init()">
<SCRIPT LANGUAGE="VBScript">
Function Gantt1_MouseMove(Button, Shift, X, Y)
	With Gantt1
		.ShowToolTip .Chart.BarFromPoint(-1,-1),"","8","8"
	End With
End Function
</SCRIPT>

<OBJECT CLASSID="clsid:09C0C400-3A0F-4CD3-8B93-8D42FCE66726" id="Gantt1"></OBJECT>

<SCRIPT LANGUAGE="VBScript">
Function Init()
	With Gantt1
		.BeginUpdate
		.Columns.Add "Def"
		With .Chart
			.PaneWidth(False) = 64
			.LevelCount = 2
			.FirstVisibleDate = #1/1/2010#
		End With
		With .Items
			h = .AddItem("Task")
			.AddBar h,"Task",#1/2/2010#,#1/5/2010#,"A","A"
			.AddBar h,"Task",#1/5/2010#,#1/8/2010#,"B","B"
			.AddBar h,"Task",#1/8/2010#,#1/11/2010#,"C","C"
		End With
		.EndUpdate
	End With
End Function
</SCRIPT>
</BODY>
|
|
746
|
Is it possible to move an item from a parent to another

<BODY onload="Init()">
<OBJECT CLASSID="clsid:09C0C400-3A0F-4CD3-8B93-8D42FCE66726" id="Gantt1"></OBJECT>

<SCRIPT LANGUAGE="VBScript">
Function Init()
	With Gantt1
		.BeginUpdate
		.LinesAtRoot = -1
		.Columns.Add "Items"
		With .Items
			.AddItem "A"
			.AddItem "B"
			.InsertItem .AddItem("C"),"","D"
			.SetParent .FindItem("D",0),.FindItem("A",0)
		End With
		.EndUpdate
	End With
End Function
</SCRIPT>
</BODY>
|
|
745
|
How can I change the identation for an item
<BODY onload="Init()">
<OBJECT CLASSID="clsid:09C0C400-3A0F-4CD3-8B93-8D42FCE66726" id="Gantt1"></OBJECT>

<SCRIPT LANGUAGE="VBScript">
Function Init()
	With Gantt1
		.BeginUpdate
		.LinesAtRoot = -1
		.Columns.Add "Items"
		With .Items
			.AddItem "A"
			.AddItem "B"
			.InsertItem .AddItem("C"),"","D"
			.SetParent .FindItem("D",0),0
		End With
		.EndUpdate
	End With
End Function
</SCRIPT>
</BODY>
|
|
744
|
How can I specify the levels using the user's Regional and Language Options
<BODY onload="Init()">
<OBJECT CLASSID="clsid:09C0C400-3A0F-4CD3-8B93-8D42FCE66726" id="Gantt1"></OBJECT>

<SCRIPT LANGUAGE="VBScript">
Function Init()
	With Gantt1
		.BeginUpdate
		.Font.Name = "Arial Unicode MS"
		.HeaderHeight = 36
		With .Chart
			.FirstVisibleDate = #5/30/2010#
			.PaneWidth(False) = 0
			.FirstWeekDay = 1
			.UnitWidth = 36
			.LevelCount = 2
			With .Level(0)
				.Label = "<b><%loc_mmmm%></b> <%yyyy%><br><%loc_sdate%><r> <%ww%> "
				.ToolTip = .Label
				.Unit = 256
			End With
			With .Level(1)
				.Label = "<%loc_ddd%><br><%d%>"
				.ToolTip = .Label
			End With
			.ToolTip = "<%loc_ldate%>"
		End With
		.EndUpdate
	End With
End Function
</SCRIPT>
</BODY>
|
|
743
|
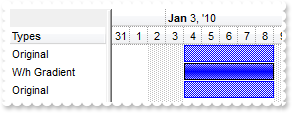
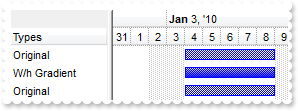
How can I display a bar only using a gradient color and shadow
<BODY onload="Init()">
<OBJECT CLASSID="clsid:09C0C400-3A0F-4CD3-8B93-8D42FCE66726" id="Gantt1"></OBJECT>
<SCRIPT LANGUAGE="VBScript">
Function Init()
With Gantt1
.BeginUpdate
With .Chart
.FirstVisibleDate = #12/31/2009#
.LevelCount = 2
.PaneWidth(False) = 96
With .Bars.Item("Task")
.StartColor = RGB(255,255,255)
.EndColor = .Color
End With
End With
.Columns.Add "Types"
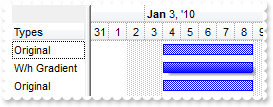
With .Items
.AddBar .AddItem("Original"),"Task",#1/4/2010#,#1/9/2010#,""
h = .AddItem("W/h Gradient")
.AddBar h,"Task",#1/4/2010#,#1/9/2010#,""
.ItemBar(h,"",17) = 8291
.AddBar .AddItem("Original"),"Task",#1/4/2010#,#1/9/2010#,""
End With
.EndUpdate
End With
End Function
</SCRIPT>
</BODY>
|
|
742
|
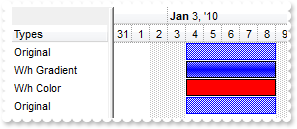
Is it possible to display a bar only using a gradient color using the exBarColor option
<BODY onload="Init()">
<OBJECT CLASSID="clsid:09C0C400-3A0F-4CD3-8B93-8D42FCE66726" id="Gantt1"></OBJECT>

<SCRIPT LANGUAGE="VBScript">
Function Init()
	With Gantt1
		.BeginUpdate
		With .Chart
			.FirstVisibleDate = #12/31/2009#
			.LevelCount = 2
			.PaneWidth(False) = 96
			With .Bars.Item("Task")
				.StartColor = RGB(255,255,255)
				.EndColor = .StartColor
				.Height = 17
			End With
		End With
		.Columns.Add "Types"
		With .Items
			.AddBar .AddItem("Original"),"Task",#1/4/2010#,#1/9/2010#,""
			h = .AddItem("W/h Gradient")
			.AddBar h,"Task",#1/4/2010#,#1/9/2010#,""
			.ItemBar(h,"",17) = 227
			h = .AddItem("W/h Color")
			.AddBar h,"Task",#1/4/2010#,#1/9/2010#,""
			.ItemBar(h,"",17) = 227
			.ItemBar(h,"",513) = 255
			.AddBar .AddItem("Original"),"Task",#1/4/2010#,#1/9/2010#,""
		End With
		.EndUpdate
	End With
End Function
</SCRIPT>
</BODY>
|
|
741
|
Is it possible to display a bar only using a gradient color
<BODY onload="Init()">
<OBJECT CLASSID="clsid:09C0C400-3A0F-4CD3-8B93-8D42FCE66726" id="Gantt1"></OBJECT>

<SCRIPT LANGUAGE="VBScript">
Function Init()
	With Gantt1
		.BeginUpdate
		With .Chart
			.FirstVisibleDate = #12/31/2009#
			.LevelCount = 2
			.PaneWidth(False) = 96
			With .Bars.Item("Task")
				.StartColor = RGB(255,255,255)
				.EndColor = .StartColor
				.Height = 17
			End With
		End With
		.Columns.Add "Types"
		With .Items
			.AddBar .AddItem("Original"),"Task",#1/4/2010#,#1/9/2010#,""
			h = .AddItem("W/h Gradient")
			.AddBar h,"Task",#1/4/2010#,#1/9/2010#,""
			.ItemBar(h,"",17) = 227
			.AddBar .AddItem("Original"),"Task",#1/4/2010#,#1/9/2010#,""
		End With
		.EndUpdate
	End With
End Function
</SCRIPT>
</BODY>
|
|
740
|
Is it possible to display a bar only using a gradient color
<BODY onload="Init()">
<OBJECT CLASSID="clsid:09C0C400-3A0F-4CD3-8B93-8D42FCE66726" id="Gantt1"></OBJECT>

<SCRIPT LANGUAGE="VBScript">
Function Init()
	With Gantt1
		.BeginUpdate
		With .Chart
			.FirstVisibleDate = #12/31/2009#
			.LevelCount = 2
			.PaneWidth(False) = 96
			With .Bars.Item("Task")
				.StartColor = RGB(255,255,255)
				.EndColor = .Color
			End With
		End With
		.Columns.Add "Types"
		With .Items
			.AddBar .AddItem("Original"),"Task",#1/4/2010#,#1/9/2010#,""
			h = .AddItem("W/h Gradient")
			.AddBar h,"Task",#1/4/2010#,#1/9/2010#,""
			.ItemBar(h,"",17) = 99
			.AddBar .AddItem("Original"),"Task",#1/4/2010#,#1/9/2010#,""
		End With
		.EndUpdate
	End With
End Function
</SCRIPT>
</BODY>
|
|
739
|
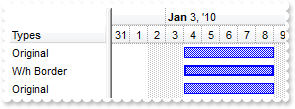
How can I display a specified bar only with a thicker border
<BODY onload="Init()">
<OBJECT CLASSID="clsid:09C0C400-3A0F-4CD3-8B93-8D42FCE66726" id="Gantt1"></OBJECT>

<SCRIPT LANGUAGE="VBScript">
Function Init()
	With Gantt1
		.BeginUpdate
		With .Chart
			.FirstVisibleDate = #12/31/2009#
			.LevelCount = 2
			.PaneWidth(False) = 96
		End With
		.Columns.Add "Types"
		With .Items
			.AddBar .AddItem("Original"),"Task",#1/4/2010#,#1/9/2010#,""
			h = .AddItem("W/h Border")
			.AddBar h,"Task",#1/4/2010#,#1/9/2010#,""
			.ItemBar(h,"",17) = 4099
			.AddBar .AddItem("Original"),"Task",#1/4/2010#,#1/9/2010#,""
		End With
		.EndUpdate
	End With
End Function
</SCRIPT>
</BODY>
|
|
738
|
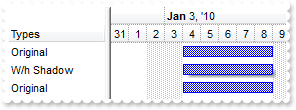
Is it possible to display the shadow for a specified bar
<BODY onload="Init()">
<OBJECT CLASSID="clsid:09C0C400-3A0F-4CD3-8B93-8D42FCE66726" id="Gantt1"></OBJECT>

<SCRIPT LANGUAGE="VBScript">
Function Init()
	With Gantt1
		.BeginUpdate
		With .Chart
			.FirstVisibleDate = #12/31/2009#
			.LevelCount = 2
			.PaneWidth(False) = 96
		End With
		.Columns.Add "Types"
		With .Items
			.AddBar .AddItem("Original"),"Task",#1/4/2010#,#1/9/2010#,""
			h = .AddItem("W/h Shadow")
			.AddBar h,"Task",#1/4/2010#,#1/9/2010#,""
			.ItemBar(h,"",17) = 8195
			.AddBar .AddItem("Original"),"Task",#1/4/2010#,#1/9/2010#,""
		End With
		.EndUpdate
	End With
End Function
</SCRIPT>
</BODY>
|
|
737
|
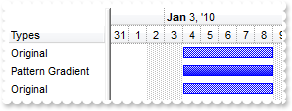
Is it possible to display the task bars with a gradient color
<BODY onload="Init()">
<OBJECT CLASSID="clsid:09C0C400-3A0F-4CD3-8B93-8D42FCE66726" id="Gantt1"></OBJECT>

<SCRIPT LANGUAGE="VBScript">
Function Init()
	With Gantt1
		.BeginUpdate
		With .Chart
			.FirstVisibleDate = #12/31/2009#
			.LevelCount = 2
			.PaneWidth(False) = 96
			.Bars.Copy "Task","TaskO"
			With .Bars.Item("Task")
				.Pattern = 99 ' PatternEnum.exPatternGradientVBox Or PatternEnum.exPatternBox Or PatternEnum.exPatternShadow
				.StartColor = RGB(255,255,255)
				.EndColor = .Color
			End With
		End With
		.Columns.Add "Types"
		With .Items
			.AddBar .AddItem("Original"),"TaskO",#1/4/2010#,#1/9/2010#,""
			.AddBar .AddItem("Pattern Gradient"),"Task",#1/4/2010#,#1/9/2010#,""
			.AddBar .AddItem("Original"),"TaskO",#1/4/2010#,#1/9/2010#,""
		End With
		.EndUpdate
	End With
End Function
</SCRIPT>
</BODY>
|
|
736
|
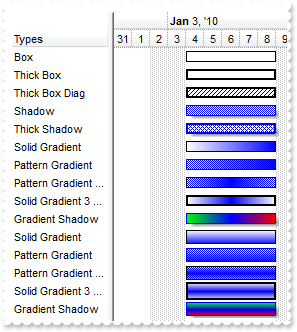
How can I know the type of bars I can displays using predefined patterns
<BODY onload="Init()">
<OBJECT CLASSID="clsid:09C0C400-3A0F-4CD3-8B93-8D42FCE66726" id="Gantt1"></OBJECT>

<SCRIPT LANGUAGE="VBScript">
Function Init()
	With Gantt1
		.BeginUpdate
		With .Chart
			.FirstVisibleDate = #12/31/2009#
			.LevelCount = 2
			.PaneWidth(False) = 96
			With .Bars
				.Add("Box").Pattern = 32
				.Add("ThickBox").Pattern = 4128 ' PatternEnum.exPatternThickBox Or PatternEnum.exPatternBox
				.Add("DiagBox").Pattern = 4102 ' PatternEnum.exPatternThickBox Or PatternEnum.exPatternBDiagonal
				.Copy("Task","Shadow").Pattern = 8195 ' PatternEnum.exPatternFrameShadow Or PatternEnum.exPatternShadow
				.Copy("Task","TShadow").Pattern = 12295 ' PatternEnum.exPatternFrameShadow Or PatternEnum.exPatternThickBox Or PatternEnum.exPatternDiagCross
				With .Add("HGrad1")
					.Pattern = 32
					.StartColor = RGB(255,255,255)
					.EndColor = RGB(0,0,255)
				End With
				With .Add("HGrad2")
					.Pattern = 35 ' PatternEnum.exPatternBox Or PatternEnum.exPatternShadow
					.StartColor = RGB(255,255,255)
					.EndColor = RGB(0,0,255)
					.Color = RGB(0,0,255)
				End With
				With .Add("HGrad3")
					.Pattern = 163 ' PatternEnum.exPatternGradient3Colors Or PatternEnum.exPatternBox Or PatternEnum.exPatternShadow
					.StartColor = RGB(255,255,255)
					.EndColor = .StartColor
					.Color = RGB(0,0,255)
				End With
				With .Add("HGrad4")
					.Pattern = 4256 ' PatternEnum.exPatternThickBox Or PatternEnum.exPatternGradient3Colors Or PatternEnum.exPatternBox
					.StartColor = RGB(255,255,255)
					.EndColor = .StartColor
					.Color = RGB(0,0,255)
				End With
				With .Add("HGrad5")
					.Pattern = 8352 ' PatternEnum.exPatternFrameShadow Or PatternEnum.exPatternGradient3Colors Or PatternEnum.exPatternBox
					.StartColor = RGB(0,255,0)
					.EndColor = RGB(255,0,0)
					.Color = RGB(0,0,255)
				End With
				With .Add("VGrad1")
					.Pattern = 96 ' PatternEnum.exPatternGradientVBox Or PatternEnum.exPatternBox
					.StartColor = RGB(255,255,255)
					.EndColor = RGB(0,0,255)
					.Height = 14
				End With
				With .Add("VGrad2")
					.Pattern = 99 ' PatternEnum.exPatternGradientVBox Or PatternEnum.exPatternBox Or PatternEnum.exPatternShadow
					.StartColor = RGB(255,255,255)
					.EndColor = RGB(0,0,255)
					.Color = RGB(0,0,255)
					.Height = 14
				End With
				With .Add("VGrad3")
					.Pattern = 227 ' PatternEnum.exPatternGradient3Colors Or PatternEnum.exPatternGradientVBox Or PatternEnum.exPatternBox Or PatternEnum.exPatternShadow
					.StartColor = RGB(255,255,255)
					.EndColor = .StartColor
					.Color = RGB(0,0,255)
					.Height = 14
				End With
				With .Add("VGrad4")
					.Pattern = 4320 ' PatternEnum.exPatternThickBox Or PatternEnum.exPatternGradient3Colors Or PatternEnum.exPatternGradientVBox Or PatternEnum.exPatternBox
					.StartColor = RGB(255,255,255)
					.EndColor = .StartColor
					.Color = RGB(0,0,255)
					.Height = -1
				End With
				With .Add("VGrad5")
					.Pattern = 8416 ' PatternEnum.exPatternFrameShadow Or PatternEnum.exPatternGradient3Colors Or PatternEnum.exPatternGradientVBox Or PatternEnum.exPatternBox
					.StartColor = RGB(0,255,0)
					.EndColor = RGB(255,0,0)
					.Color = RGB(0,0,255)
					.Height = 14
				End With
			End With
		End With
		.Columns.Add "Types"
		With .Items
			.AddBar .AddItem("Box"),"Box",#1/4/2010#,#1/9/2010#,""
			.AddBar .AddItem("Thick Box"),"ThickBox",#1/4/2010#,#1/9/2010#,""
			.AddBar .AddItem("Thick Box Diag"),"DiagBox",#1/4/2010#,#1/9/2010#,""
			.AddBar .AddItem("Shadow"),"Shadow",#1/4/2010#,#1/9/2010#,""
			.AddBar .AddItem("Thick Shadow"),"TShadow",#1/4/2010#,#1/9/2010#,""
			.AddBar .AddItem("Solid Gradient"),"HGrad1",#1/4/2010#,#1/9/2010#,""
			.AddBar .AddItem("Pattern Gradient"),"HGrad2",#1/4/2010#,#1/9/2010#,""
			.AddBar .AddItem("Pattern Gradient 3 Colors"),"HGrad3",#1/4/2010#,#1/9/2010#,""
			.AddBar .AddItem("Solid Gradient 3 Colors"),"HGrad4",#1/4/2010#,#1/9/2010#,""
			.AddBar .AddItem("Gradient Shadow"),"HGrad5",#1/4/2010#,#1/9/2010#,""
			.AddBar .AddItem("Solid Gradient"),"VGrad1",#1/4/2010#,#1/9/2010#,""
			.AddBar .AddItem("Pattern Gradient"),"VGrad2",#1/4/2010#,#1/9/2010#,""
			.AddBar .AddItem("Pattern Gradient 3 Colors"),"VGrad3",#1/4/2010#,#1/9/2010#,""
			.AddBar .AddItem("Solid Gradient 3 Colors"),"VGrad4",#1/4/2010#,#1/9/2010#,""
			.AddBar .AddItem("Gradient Shadow"),"VGrad5",#1/4/2010#,#1/9/2010#,""
		End With
		.EndUpdate
	End With
End Function
</SCRIPT>
</BODY>
|
|
735
|
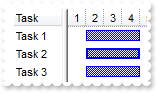
Is it possible to display the bars with a thicker border
<BODY onload="Init()">
<OBJECT CLASSID="clsid:09C0C400-3A0F-4CD3-8B93-8D42FCE66726" id="Gantt1"></OBJECT>

<SCRIPT LANGUAGE="VBScript">
Function Init()
	With Gantt1
		.BeginUpdate
		.Columns.Add "Task"
		.Chart.FirstVisibleDate = #1/1/2001#
		.Chart.PaneWidth(False) = 48
		.Chart.Bars.Copy("Task","TaskB").Pattern = 4099 ' PatternEnum.exPatternThickBox Or PatternEnum.exPatternShadow
		With .Items
			.AddBar .AddItem("Task 1"),"Task",#1/2/2001#,#1/5/2001#,""
			.AddBar .AddItem("Task 2"),"TaskB",#1/2/2001#,#1/5/2001#,""
			.AddBar .AddItem("Task 3"),"Task",#1/2/2001#,#1/5/2001#,""
		End With
		.EndUpdate
	End With
End Function
</SCRIPT>
</BODY>
|
|
734
|
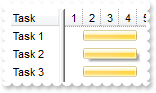
Is it possible to display the shadow for EBN bars
<BODY onload="Init()">
<OBJECT CLASSID="clsid:09C0C400-3A0F-4CD3-8B93-8D42FCE66726" id="Gantt1"></OBJECT>

<SCRIPT LANGUAGE="VBScript">
Function Init()
	With Gantt1
		.BeginUpdate
		.VisualAppearance.Add 1,"c:\exontrol\images\normal.ebn"
		.Columns.Add "Task"
		.Chart.FirstVisibleDate = #1/1/2001#
		.Chart.PaneWidth(False) = 48
		With .Chart.Bars.Copy("Task","EBN")
			.Color = &H1000000
			.Pattern = 8192
		End With
		.Chart.Bars.Copy("Task","EBN2").Color = &H1000000
		With .Items
			.AddBar .AddItem("Task 1"),"EBN2",#1/2/2001#,#1/5/2001#,""
			.AddBar .AddItem("Task 2"),"EBN",#1/2/2001#,#1/5/2001#,""
			.AddBar .AddItem("Task 3"),"EBN2",#1/2/2001#,#1/5/2001#,""
		End With
		.EndUpdate
	End With
End Function
</SCRIPT>
</BODY>
|
|
733
|
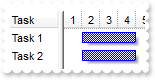
Can I display a shadow for my bars
<BODY onload="Init()">
<OBJECT CLASSID="clsid:09C0C400-3A0F-4CD3-8B93-8D42FCE66726" id="Gantt1"></OBJECT>

<SCRIPT LANGUAGE="VBScript">
Function Init()
	With Gantt1
		.BeginUpdate
		.Columns.Add "Task"
		.Chart.FirstVisibleDate = #1/1/2001#
		.Chart.PaneWidth(False) = 48
		.Chart.Bars.Item("Task").Pattern = 8195 ' PatternEnum.exPatternFrameShadow Or PatternEnum.exPatternShadow
		With .Items
			.AddBar .AddItem("Task 1"),"Task",#1/2/2001#,#1/5/2001#,""
			.AddBar .AddItem("Task 2"),"Task",#1/2/2001#,#1/5/2001#,""
		End With
		.EndUpdate
	End With
End Function
</SCRIPT>
</BODY>
|
|
732
|
How can I use the Color property for gradient bars
<BODY onload="Init()">
<OBJECT CLASSID="clsid:09C0C400-3A0F-4CD3-8B93-8D42FCE66726" id="Gantt1"></OBJECT>

<SCRIPT LANGUAGE="VBScript">
Function Init()
	With Gantt1
		.BeginUpdate
		.Columns.Add "Task"
		.Chart.FirstVisibleDate = #1/1/2001#
		.Chart.PaneWidth(False) = 48
		With .Chart.Bars.Add("V")
			.Color = RGB(255,0,0)
			.StartColor = RGB(0,255,0)
			.EndColor = .StartColor
			.Pattern = 224 ' PatternEnum.exPatternGradient3Colors Or PatternEnum.exPatternGradientVBox Or PatternEnum.exPatternBox
			.Height = -1
		End With
		With .Chart.Bars.Add("H")
			.Color = RGB(255,0,0)
			.StartColor = RGB(0,255,0)
			.EndColor = .StartColor
			.Pattern = 160 ' PatternEnum.exPatternGradient3Colors Or PatternEnum.exPatternBox
		End With
		With .Items
			.AddBar .AddItem("Task 1"),"V",#1/2/2001#,#1/5/2001#,""
			.AddBar .AddItem("Task 2"),"H",#1/2/2001#,#1/5/2001#,""
		End With
		.EndUpdate
	End With
End Function
</SCRIPT>
</BODY>
|
|
731
|
Is there any option to show bars with vertical gradient
<BODY onload="Init()">
<OBJECT CLASSID="clsid:09C0C400-3A0F-4CD3-8B93-8D42FCE66726" id="Gantt1"></OBJECT>

<SCRIPT LANGUAGE="VBScript">
Function Init()
	With Gantt1
		.Columns.Add "Task"
		.Chart.FirstVisibleDate = #1/1/2001#
		With .Chart.Bars.Item("Task")
			.Color = RGB(255,0,0)
			.StartColor = RGB(0,255,0)
			.EndColor = RGB(255,255,0)
			.Pattern = 96 ' PatternEnum.exPatternGradientVBox Or PatternEnum.exPatternBox
		End With
		With .Items
			h = .AddItem("Task")
			.AddBar h,"Task",#1/2/2001#,#1/5/2001#,""
		End With
	End With
End Function
</SCRIPT>
</BODY>
|
|
730
|
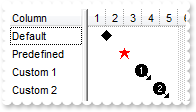
How can I define a new milestone bar
<BODY onload="Init()">
<OBJECT CLASSID="clsid:09C0C400-3A0F-4CD3-8B93-8D42FCE66726" id="Gantt1"></OBJECT>

<SCRIPT LANGUAGE="VBScript">
Function Init()
	With Gantt1
		.BeginUpdate
		.Images "gBJJgBAIDAAGAAEAAQhYAf8Pf4hh0QihCJo2AEZjQAjEZFEaIEaEEaAIAkcbk0olUrlktl0vmExmUzmk1m03nE5nU7nk9n0/oFBoVDolFo1HpFJpVLplNp1PqFRqVTq" & _
		"lVq1XrFZrVbrldr1fsFhsVjslls1ntFptVrtltt1vuFxuVzul1u13vF5vV7vl9v1/wGBwWDwmFw2HxGJxWLxmNx0xiFdyOTh8Tf9ZymXx+QytcyNgz8r0OblWjyWds+m" & _
		"0ka1Vf1ta1+r1mos2xrG2xeZ0+a0W0qOx3GO4NV3WeyvD2XJ5XL5nN51aiw+lfSj0gkUkAEllHanHI5j/cHg8EZf7w8vl8j4f/qfEZeB09/vjLAB30+kZQAP/P5/H6/y" & _
		"NAOAEAwCjMBwFAEDwJBMDwLBYAP2/8Hv8/gAGAD8LQs9w/nhDY/oygIA="
		.Chart.FirstVisibleDate = #1/1/2001#
		With .Chart.Bars
			.AddShapeCorner 12345,1
			.AddShapeCorner 12346,2
			.Copy("Milestone","M1").StartShape = 12345 ' &H3020 Or ShapeCornerEnum.exShapeIconVBar Or ShapeCornerEnum.exShapeIconRight
			.Copy("Milestone","M2").StartShape = 12346 ' &H3020 Or ShapeCornerEnum.exShapeIconSquare Or ShapeCornerEnum.exShapeIconRight
			With .Copy("Milestone","MP")
				.StartShape = 20
				.StartColor = RGB(255,0,0)
			End With
		End With
		.Columns.Add "Column"
		With .Items
			.AddBar .AddItem("Default"),"Milestone",#1/2/2001#,#1/2/2001#
			.AddBar .AddItem("Predefined"),"MP",#1/3/2001#,#1/3/2001#
			.AddBar .AddItem("Custom 1"),"M1",#1/4/2001#,#1/4/2001#
			.AddBar .AddItem("Custom 2"),"M2",#1/5/2001#,#1/5/2001#
		End With
		.EndUpdate
	End With
End Function
</SCRIPT>
</BODY>
|
|
729
|
How can I define my milestone bar, using my icons or pictures
<BODY onload="Init()">
<OBJECT CLASSID="clsid:09C0C400-3A0F-4CD3-8B93-8D42FCE66726" id="Gantt1"></OBJECT>

<SCRIPT LANGUAGE="VBScript">
Function Init()
	With Gantt1
		.Images "gBJJgBAIDAAGAAEAAQhYAf8Pf4hh0QihCJo2AEZjQAjEZFEaIEaEEaAIAkcbk0olUrlktl0vmExmUzmk1m03nE5nU7nk9n0/oFBoVDolFo1HpFJpVLplNp1PqFRqVTq" & _
		"lVq1XrFZrVbrldr1fsFhsVjslls1ntFptVrtltt1vuFxuVzul1u13vF5vV7vl9v1/wGBwWDwmFw2HxGJxWLxmNx0xiFdyOTh8Tf9ZymXx+QytcyNgz8r0OblWjyWds+m" & _
		"0ka1Vf1ta1+r1mos2xrG2xeZ0+a0W0qOx3GO4NV3WeyvD2XJ5XL5nN51aiw+lfSj0gkUkAEllHanHI5j/cHg8EZf7w8vl8j4f/qfEZeB09/vjLAB30+kZQAP/P5/H6/y" & _
		"NAOAEAwCjMBwFAEDwJBMDwLBYAP2/8Hv8/gAGAD8LQs9w/nhDY/oygIA="
		.Chart.FirstVisibleDate = #1/1/2001#
		With .Chart.Bars
			.AddShapeCorner 12345,1
			.Item("Milestone").StartShape = 12345 ' &H3020 Or ShapeCornerEnum.exShapeIconVBar Or ShapeCornerEnum.exShapeIconRight
		End With
		.Columns.Add "Column"
		With .Items
			.AddBar .AddItem("Item 1"),"Milestone",#1/2/2001#,#1/2/2001#
		End With
	End With
End Function
</SCRIPT>
</BODY>
|
|
728
|
I haven't found options to localize (in Italian) the strings ( dates, tooltip ) that shows in the chart area
<BODY onload="Init()">
<OBJECT CLASSID="clsid:09C0C400-3A0F-4CD3-8B93-8D42FCE66726" id="Gantt1"></OBJECT>
<SCRIPT LANGUAGE="VBScript">
Function Init()
With Gantt1
.BeginUpdate
With .Chart
.LevelCount = 2
.PaneWidth(False) = 0
.Label(256) = "<|><%ww%><|><%d%> <%m3%> '<%yy%><r><%ww%><|><%d%> <%mmmm%> <%yyyy%><r><%ww%><||><||>256"
.Label(4096) = "<|><%d1%><|><%d2%><|><%d3%><|><%dddd%><|><%d3%> <%d%> <%m3%> '<%yy%><|><%dddd%> <%d%> <%mmmm%> <%yyyy%><||><||>4096"
.LabelToolTip(256) = "<%d%> <%mmmm%> <%yyyy%> <%ww%>"
.LabelToolTip(4096) = "<%dddd%> <%d%> <%mmmm%> <%yyyy%>"
.FirstWeekDay = 1
.MonthNames = "gennaio febbraio marzo aprile maggio giugno luglio agosto settembre ottobre novembre dicembre"
.WeekDays = "domenica luned� marted� mercoled� gioved� venerd� sabato"
.ToolTip = "<%dddd%> <%d%> <%mmmm%> <%yyyy%>"
.UnitScale = 4096
End With
.EndUpdate
End With
End Function
</SCRIPT>
</BODY>
|
|
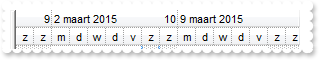
727
|
I haven't found options to localize (in Dutch) the strings ( dates, tooltip ) that shows in the chart area
<BODY onload="Init()">
<OBJECT CLASSID="clsid:09C0C400-3A0F-4CD3-8B93-8D42FCE66726" id="Gantt1"></OBJECT>

<SCRIPT LANGUAGE="VBScript">
Function Init()
	With Gantt1
		.BeginUpdate
		With .Chart
			.LevelCount = 2
			.PaneWidth(False) = 0
			.Label(256) = "<|><%ww%><|><%d%> <%m3%> '<%yy%><r><%ww%><|><%d%> <%mmmm%> <%yyyy%><r><%ww%><||><||>256"
			.Label(4096) = "<|><%d1%><|><%d2%><|><%d3%><|><%dddd%><|><%d3%> <%d%> <%m3%> '<%yy%><|><%dddd%> <%d%> <%mmmm%> <%yyyy%><||><||>4096"
			.LabelToolTip(256) = "<%d%> <%mmmm%> <%yyyy%> <%ww%>"
			.LabelToolTip(4096) = "<%dddd%> <%d%> <%mmmm%> <%yyyy%>"
			.FirstWeekDay = 1
			.MonthNames = "januari februari maart april mei juni juli augusts september oktober november december"
			.WeekDays = "zondag maandag dinsdag woensdag donderdag vrijdag zaterdag"
			.ToolTip = "<%dddd%> <%d%> <%mmmm%> <%yyyy%>"
			.UnitScale = 4096
		End With
		.EndUpdate
	End With
End Function
</SCRIPT>
</BODY>
|
|
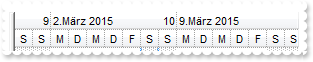
726
|
I haven't found options to localize (in German) the strings ( dates, tooltip ) that shows in the chart area
<BODY onload="Init()">
<OBJECT CLASSID="clsid:09C0C400-3A0F-4CD3-8B93-8D42FCE66726" id="Gantt1"></OBJECT>
<SCRIPT LANGUAGE="VBScript">
Function Init()
With Gantt1
.BeginUpdate
With .Chart
.LevelCount = 2
.PaneWidth(False) = 0
.Label(256) = "<|><%ww%><|><%d%> <%m3%> '<%yy%><r><%ww%><|><%d%>.<%mmmm%> <%yyyy%><r><%ww%><||><||>256"
.Label(4096) = "<|><%d1%><|><%d2%><|><%d3%><|><%dddd%><|><%d3%> <%d%>.<%m3%> '<%yy%><|><%dddd%> <%d%>.<%mmmm%> <%yyyy%><||><||>4096"
.LabelToolTip(256) = "<%d%>.<%mmmm%> <%yyyy%> <%ww%>"
.LabelToolTip(4096) = "<%dddd%>, <%d%>.<%mmmm%> <%yyyy%>"
.FirstWeekDay = 1
.MonthNames = "Januar Februar M�rz April Mai Juni Juli August September Oktober November Dezember"
.WeekDays = "Sonntag Montag Dienstag Mittwoch Donnerstag Freitag Samstag"
.ToolTip = "<%dddd%>,<%d%>.<%mmmm%> <%yyyy%>"
.UnitScale = 4096
End With
.EndUpdate
End With
End Function
</SCRIPT>
</BODY>
|
|
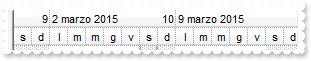
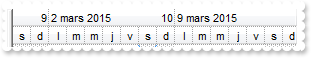
725
|
I haven't found options to localize (in French) the strings ( dates, tooltip ) that shows in the chart area
<BODY onload="Init()">
<OBJECT CLASSID="clsid:09C0C400-3A0F-4CD3-8B93-8D42FCE66726" id="Gantt1"></OBJECT>
<SCRIPT LANGUAGE="VBScript">
Function Init()
With Gantt1
.BeginUpdate
With .Chart
.LevelCount = 2
.PaneWidth(False) = 0
.Label(256) = "<|><%ww%><|><%d%> <%m3%> '<%yy%><r><%ww%><|><%d%> <%mmmm%> <%yyyy%><r><%ww%><||><||>256"
.Label(4096) = "<|><%d1%><|><%d2%><|><%d3%><|><%dddd%><|><%d3%> <%d%> <%m3%> '<%yy%><|><%dddd%> <%d%> <%mmmm%> <%yyyy%><||><||>4096"
.LabelToolTip(256) = "<%d%> <%mmmm%> <%yyyy%> <%ww%>"
.LabelToolTip(4096) = "<%dddd%> <%d%> <%mmmm%> <%yyyy%>"
.FirstWeekDay = 1
.MonthNames = "janvier f�vrier mars avril mai juin juillet ao�t septembre octobre novembre d�cembre"
.WeekDays = "dimanche lundi mardi mercredi jeudi vendredi samedi"
.ToolTip = "<%dddd%> <%d%> <%mmmm%> <%yyyy%>"
.UnitScale = 4096
End With
.EndUpdate
End With
End Function
</SCRIPT>
</BODY>
|
|
724
|
How can I filter programatically using more columns
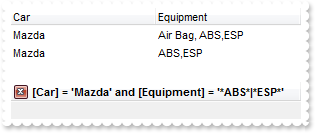
<BODY onload="Init()">
<OBJECT CLASSID="clsid:09C0C400-3A0F-4CD3-8B93-8D42FCE66726" id="Gantt1"></OBJECT>

<SCRIPT LANGUAGE="VBScript">
Function Init()
	With Gantt1
		.BeginUpdate
		.Chart.PaneWidth(True) = 0
		With .Columns
			.Add "Car"
			.Add "Equipment"
		End With
		With .Items
			.CellCaption(.AddItem("Mazda"),1) = "Air Bag"
			.CellCaption(.AddItem("Toyota"),1) = "Air Bag,Air condition"
			.CellCaption(.AddItem("Ford"),1) = "Air condition"
			.CellCaption(.AddItem("Nissan"),1) = "Air Bag,ABS,ESP"
			.CellCaption(.AddItem("Mazda"),1) = "Air Bag, ABS,ESP"
			.CellCaption(.AddItem("Mazda"),1) = "ABS,ESP"
		End With
		With .Columns.Item("Car")
			.FilterType = 240
			.Filter = "Mazda"
		End With
		With .Columns.Item("Equipment")
			.FilterType = 3
			.Filter = "*ABS*|*ESP*"
		End With
		.ApplyFilter
		.EndUpdate
	End With
End Function
</SCRIPT>
</BODY>
|
|
723
|
I have seen the IN function but it returns -1 or 0. How can I display the value being found ( SWITCH usage )
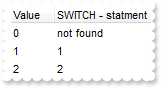
<BODY onload="Init()">
<OBJECT CLASSID="clsid:09C0C400-3A0F-4CD3-8B93-8D42FCE66726" id="Gantt1"></OBJECT>

<SCRIPT LANGUAGE="VBScript">
Function Init()
	With Gantt1
		.BeginUpdate
		With .Columns.Add("Value")
			.Width = 24
		End With
		With .Columns.Add("SWITCH - statment")
			.ComputedField = "%0 switch ('not found', 1,2,3,4,5,7,8,9,11,13,14)"
			.ToolTip = .ComputedField
		End With
		With .Items
			.AddItem 0
			.AddItem 1
			.AddItem 2
		End With
		.EndUpdate
	End With
End Function
</SCRIPT>
</BODY>
|
|
722
|
I have a large collection of constant values and using or operator is a time consuming (IN usage). Is there any way to increase the speed to check if a value maches the collection
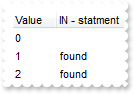
<BODY onload="Init()">
<OBJECT CLASSID="clsid:09C0C400-3A0F-4CD3-8B93-8D42FCE66726" id="Gantt1"></OBJECT>

<SCRIPT LANGUAGE="VBScript">
Function Init()
	With Gantt1
		.BeginUpdate
		With .Columns.Add("Value")
			.Width = 24
		End With
		With .Columns.Add("IN - statment")
			.ComputedField = "%0 in (1,2,3,4,5,7,8,9,11,13,14) ? 'found' : ''"
			.ToolTip = .ComputedField
		End With
		With .Items
			.AddItem 0
			.AddItem 1
			.AddItem 2
		End With
		.EndUpdate
	End With
End Function
</SCRIPT>
</BODY>
|
|
721
|
How can I use the CASE statement (CASE usage)
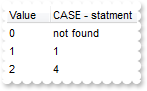
<BODY onload="Init()">
<OBJECT CLASSID="clsid:09C0C400-3A0F-4CD3-8B93-8D42FCE66726" id="Gantt1"></OBJECT>

<SCRIPT LANGUAGE="VBScript">
Function Init()
	With Gantt1
		.BeginUpdate
		With .Columns.Add("Value")
			.Width = 24
		End With
		With .Columns.Add("CASE - statment")
			.ComputedField = "%0 case (default:'not found';1:%0;2:2*%0;3:3*%0;4:4*%0;5:5*%0;7:'Seven';8:'Eight';9:'Nine';11:'Eleven';13:'Thirtheen';14:'Fourt" & _
		"heen')"
			.ToolTip = .ComputedField
		End With
		With .Items
			.AddItem 0
			.AddItem 1
			.AddItem 2
		End With
		.EndUpdate
	End With
End Function
</SCRIPT>
</BODY>
|
|
720
|
How can I use the CASE statement (CASE usage)
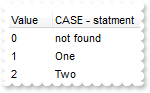
<BODY onload="Init()">
<OBJECT CLASSID="clsid:09C0C400-3A0F-4CD3-8B93-8D42FCE66726" id="Gantt1"></OBJECT>

<SCRIPT LANGUAGE="VBScript">
Function Init()
	With Gantt1
		.BeginUpdate
		With .Columns.Add("Value")
			.Width = 24
		End With
		With .Columns.Add("CASE - statment")
			.ComputedField = "%0 case (default:'not found';1:'One';2:'Two';3:'Three';4:'Four';5:'Five';7:'Seven';8:'Eight';9:'Nine';11:'Eleven';13:'Thirtheen" & _
		"';14:'Fourtheen')"
			.ToolTip = .ComputedField
		End With
		With .Items
			.AddItem 0
			.AddItem 1
			.AddItem 2
		End With
		.EndUpdate
	End With
End Function
</SCRIPT>
</BODY>
|
|
719
|
Is is possible to use HTML tags to display in the filter caption
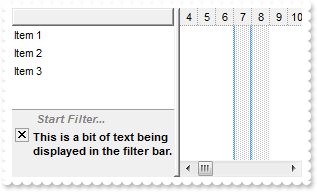
<BODY onload="Init()">
<OBJECT CLASSID="clsid:09C0C400-3A0F-4CD3-8B93-8D42FCE66726" id="Gantt1"></OBJECT>

<SCRIPT LANGUAGE="VBScript">
Function Init()
	With Gantt1
		.BeginUpdate
		.FilterBarPromptVisible = True ' True
		.FilterBarCaption = "This is a bit of text being displayed in the filter bar."
		.Columns.Add ""
		With .Items
			.AddItem "Item 1"
			.AddItem "Item 2"
			.AddItem "Item 3"
		End With
		.EndUpdate
	End With
End Function
</SCRIPT>
</BODY>
|
|
718
|
How can I find the number of items after filtering
<BODY onload="Init()">
<OBJECT CLASSID="clsid:09C0C400-3A0F-4CD3-8B93-8D42FCE66726" id="Gantt1"></OBJECT>

<SCRIPT LANGUAGE="VBScript">
Function Init()
	With Gantt1
		.BeginUpdate
		.Columns.Add ""
		With .Items
			h = .AddItem("")
			.CellCaption(h,0) = .VisibleItemCount
		End With
		.EndUpdate
	End With
End Function
</SCRIPT>
</BODY>
|
|
717
|
How can I change the filter caption
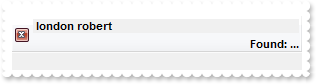
<BODY onload="Init()">
<OBJECT CLASSID="clsid:09C0C400-3A0F-4CD3-8B93-8D42FCE66726" id="Gantt1"></OBJECT>

<SCRIPT LANGUAGE="VBScript">
Function Init()
	With Gantt1
		.BeginUpdate
		.Chart.PaneWidth(True) = 0
		.ColumnAutoResize = True
		.ContinueColumnScroll = 0
		.MarkSearchColumn = False
		.SearchColumnIndex = 1
		.FilterBarPromptVisible = True ' True
		.FilterBarPromptType = 12801 ' FilterPromptEnum.exFilterPromptWords Or FilterPromptEnum.exFilterPromptContainsAll
		.FilterBarPromptPattern = "london robert"
		.FilterBarCaption = "<r>Found: ... "
		With .Columns
			.Add("Name").Width = 96
			.Add("Title").Width = 96
			.Add "City"
		End With
		With .Items
			h0 = .AddItem("Nancy Davolio")
			.CellCaption(h0,1) = "Sales Representative"
			.CellCaption(h0,2) = "Seattle"
			h0 = .AddItem("Andrew Fuller")
			.CellCaption(h0,1) = "Vice President, Sales"
			.CellCaption(h0,2) = "Tacoma"
			.SelectItem(h0) = True
			h0 = .AddItem("Janet Leverling")
			.CellCaption(h0,1) = "Sales Representative"
			.CellCaption(h0,2) = "Kirkland"
			h0 = .AddItem("Margaret Peacock")
			.CellCaption(h0,1) = "Sales Representative"
			.CellCaption(h0,2) = "Redmond"
			h0 = .AddItem("Steven Buchanan")
			.CellCaption(h0,1) = "Sales Manager"
			.CellCaption(h0,2) = "London"
			h0 = .AddItem("Michael Suyama")
			.CellCaption(h0,1) = "Sales Representative"
			.CellCaption(h0,2) = "London"
			h0 = .AddItem("Robert King")
			.CellCaption(h0,1) = "Sales Representative"
			.CellCaption(h0,2) = "London"
			h0 = .AddItem("Laura Callahan")
			.CellCaption(h0,1) = "Inside Sales Coordinator"
			.CellCaption(h0,2) = "Seattle"
			h0 = .AddItem("Anne Dodsworth")
			.CellCaption(h0,1) = "Sales Representative"
			.CellCaption(h0,2) = "London"
		End With
		.EndUpdate
	End With
End Function
</SCRIPT>
</BODY>
|
|
716
|
While using the filter prompt is it is possible to use wild characters
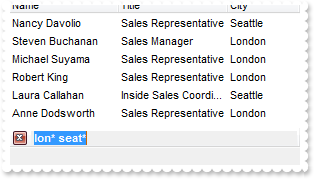
<BODY onload="Init()">
<OBJECT CLASSID="clsid:09C0C400-3A0F-4CD3-8B93-8D42FCE66726" id="Gantt1"></OBJECT>

<SCRIPT LANGUAGE="VBScript">
Function Init()
	With Gantt1
		.BeginUpdate
		.Chart.PaneWidth(True) = 0
		.ColumnAutoResize = True
		.ContinueColumnScroll = 0
		.MarkSearchColumn = False
		.SearchColumnIndex = 1
		.FilterBarPromptVisible = True ' True
		.FilterBarPromptType = 16
		.FilterBarPromptPattern = "lon* seat*"
		With .Columns
			.Add("Name").Width = 96
			.Add("Title").Width = 96
			.Add "City"
		End With
		With .Items
			h0 = .AddItem("Nancy Davolio")
			.CellCaption(h0,1) = "Sales Representative"
			.CellCaption(h0,2) = "Seattle"
			h0 = .AddItem("Andrew Fuller")
			.CellCaption(h0,1) = "Vice President, Sales"
			.CellCaption(h0,2) = "Tacoma"
			.SelectItem(h0) = True
			h0 = .AddItem("Janet Leverling")
			.CellCaption(h0,1) = "Sales Representative"
			.CellCaption(h0,2) = "Kirkland"
			h0 = .AddItem("Margaret Peacock")
			.CellCaption(h0,1) = "Sales Representative"
			.CellCaption(h0,2) = "Redmond"
			h0 = .AddItem("Steven Buchanan")
			.CellCaption(h0,1) = "Sales Manager"
			.CellCaption(h0,2) = "London"
			h0 = .AddItem("Michael Suyama")
			.CellCaption(h0,1) = "Sales Representative"
			.CellCaption(h0,2) = "London"
			h0 = .AddItem("Robert King")
			.CellCaption(h0,1) = "Sales Representative"
			.CellCaption(h0,2) = "London"
			h0 = .AddItem("Laura Callahan")
			.CellCaption(h0,1) = "Inside Sales Coordinator"
			.CellCaption(h0,2) = "Seattle"
			h0 = .AddItem("Anne Dodsworth")
			.CellCaption(h0,1) = "Sales Representative"
			.CellCaption(h0,2) = "London"
		End With
		.EndUpdate
	End With
End Function
</SCRIPT>
</BODY>
|
|
715
|
How can I list all items that contains any of specified words, not necessary at the beggining
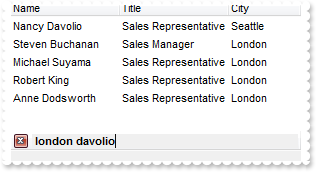
<BODY onload="Init()">
<OBJECT CLASSID="clsid:09C0C400-3A0F-4CD3-8B93-8D42FCE66726" id="Gantt1"></OBJECT>

<SCRIPT LANGUAGE="VBScript">
Function Init()
	With Gantt1
		.BeginUpdate
		.Chart.PaneWidth(True) = 0
		.ColumnAutoResize = True
		.ContinueColumnScroll = 0
		.MarkSearchColumn = False
		.SearchColumnIndex = 1
		.FilterBarPromptVisible = True ' True
		.FilterBarPromptType = 4610 ' FilterPromptEnum.exFilterPromptStartWords Or FilterPromptEnum.exFilterPromptContainsAny
		.FilterBarPromptPattern = "london davolio"
		With .Columns
			.Add("Name").Width = 96
			.Add("Title").Width = 96
			.Add "City"
		End With
		With .Items
			h0 = .AddItem("Nancy Davolio")
			.CellCaption(h0,1) = "Sales Representative"
			.CellCaption(h0,2) = "Seattle"
			h0 = .AddItem("Andrew Fuller")
			.CellCaption(h0,1) = "Vice President, Sales"
			.CellCaption(h0,2) = "Tacoma"
			.SelectItem(h0) = True
			h0 = .AddItem("Janet Leverling")
			.CellCaption(h0,1) = "Sales Representative"
			.CellCaption(h0,2) = "Kirkland"
			h0 = .AddItem("Margaret Peacock")
			.CellCaption(h0,1) = "Sales Representative"
			.CellCaption(h0,2) = "Redmond"
			h0 = .AddItem("Steven Buchanan")
			.CellCaption(h0,1) = "Sales Manager"
			.CellCaption(h0,2) = "London"
			h0 = .AddItem("Michael Suyama")
			.CellCaption(h0,1) = "Sales Representative"
			.CellCaption(h0,2) = "London"
			h0 = .AddItem("Robert King")
			.CellCaption(h0,1) = "Sales Representative"
			.CellCaption(h0,2) = "London"
			h0 = .AddItem("Laura Callahan")
			.CellCaption(h0,1) = "Inside Sales Coordinator"
			.CellCaption(h0,2) = "Seattle"
			h0 = .AddItem("Anne Dodsworth")
			.CellCaption(h0,1) = "Sales Representative"
			.CellCaption(h0,2) = "London"
		End With
		.EndUpdate
	End With
End Function
</SCRIPT>
</BODY>
|
|
714
|
How can I list all items that contains any of specified words, not strings
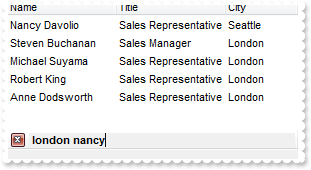
<BODY onload="Init()">
<OBJECT CLASSID="clsid:09C0C400-3A0F-4CD3-8B93-8D42FCE66726" id="Gantt1"></OBJECT>

<SCRIPT LANGUAGE="VBScript">
Function Init()
	With Gantt1
		.BeginUpdate
		.ColumnAutoResize = True
		.ContinueColumnScroll = 0
		.Chart.PaneWidth(True) = 0
		.MarkSearchColumn = False
		.SearchColumnIndex = 1
		.FilterBarPromptVisible = True ' True
		.FilterBarPromptType = 12802 ' FilterPromptEnum.exFilterPromptWords Or FilterPromptEnum.exFilterPromptContainsAny
		.FilterBarPromptPattern = "london nancy"
		With .Columns
			.Add("Name").Width = 96
			.Add("Title").Width = 96
			.Add "City"
		End With
		With .Items
			h0 = .AddItem("Nancy Davolio")
			.CellCaption(h0,1) = "Sales Representative"
			.CellCaption(h0,2) = "Seattle"
			h0 = .AddItem("Andrew Fuller")
			.CellCaption(h0,1) = "Vice President, Sales"
			.CellCaption(h0,2) = "Tacoma"
			.SelectItem(h0) = True
			h0 = .AddItem("Janet Leverling")
			.CellCaption(h0,1) = "Sales Representative"
			.CellCaption(h0,2) = "Kirkland"
			h0 = .AddItem("Margaret Peacock")
			.CellCaption(h0,1) = "Sales Representative"
			.CellCaption(h0,2) = "Redmond"
			h0 = .AddItem("Steven Buchanan")
			.CellCaption(h0,1) = "Sales Manager"
			.CellCaption(h0,2) = "London"
			h0 = .AddItem("Michael Suyama")
			.CellCaption(h0,1) = "Sales Representative"
			.CellCaption(h0,2) = "London"
			h0 = .AddItem("Robert King")
			.CellCaption(h0,1) = "Sales Representative"
			.CellCaption(h0,2) = "London"
			h0 = .AddItem("Laura Callahan")
			.CellCaption(h0,1) = "Inside Sales Coordinator"
			.CellCaption(h0,2) = "Seattle"
			h0 = .AddItem("Anne Dodsworth")
			.CellCaption(h0,1) = "Sales Representative"
			.CellCaption(h0,2) = "London"
		End With
		.EndUpdate
	End With
End Function
</SCRIPT>
</BODY>
|
|
713
|
How can I list all items that contains all specified words, not strings
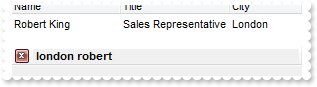
<BODY onload="Init()">
<OBJECT CLASSID="clsid:09C0C400-3A0F-4CD3-8B93-8D42FCE66726" id="Gantt1"></OBJECT>

<SCRIPT LANGUAGE="VBScript">
Function Init()
	With Gantt1
		.BeginUpdate
		.Chart.PaneWidth(True) = 0
		.ColumnAutoResize = True
		.ContinueColumnScroll = 0
		.MarkSearchColumn = False
		.SearchColumnIndex = 1
		.FilterBarPromptVisible = True ' True
		.FilterBarPromptType = 12801 ' FilterPromptEnum.exFilterPromptWords Or FilterPromptEnum.exFilterPromptContainsAll
		.FilterBarPromptPattern = "london robert"
		With .Columns
			.Add("Name").Width = 96
			.Add("Title").Width = 96
			.Add "City"
		End With
		With .Items
			h0 = .AddItem("Nancy Davolio")
			.CellCaption(h0,1) = "Sales Representative"
			.CellCaption(h0,2) = "Seattle"
			h0 = .AddItem("Andrew Fuller")
			.CellCaption(h0,1) = "Vice President, Sales"
			.CellCaption(h0,2) = "Tacoma"
			.SelectItem(h0) = True
			h0 = .AddItem("Janet Leverling")
			.CellCaption(h0,1) = "Sales Representative"
			.CellCaption(h0,2) = "Kirkland"
			h0 = .AddItem("Margaret Peacock")
			.CellCaption(h0,1) = "Sales Representative"
			.CellCaption(h0,2) = "Redmond"
			h0 = .AddItem("Steven Buchanan")
			.CellCaption(h0,1) = "Sales Manager"
			.CellCaption(h0,2) = "London"
			h0 = .AddItem("Michael Suyama")
			.CellCaption(h0,1) = "Sales Representative"
			.CellCaption(h0,2) = "London"
			h0 = .AddItem("Robert King")
			.CellCaption(h0,1) = "Sales Representative"
			.CellCaption(h0,2) = "London"
			h0 = .AddItem("Laura Callahan")
			.CellCaption(h0,1) = "Inside Sales Coordinator"
			.CellCaption(h0,2) = "Seattle"
			h0 = .AddItem("Anne Dodsworth")
			.CellCaption(h0,1) = "Sales Representative"
			.CellCaption(h0,2) = "London"
		End With
		.EndUpdate
	End With
End Function
</SCRIPT>
</BODY>
|
|
712
|
I've noticed that the filtering by prompt is not case sensitive, is is possible to make it case sensitive
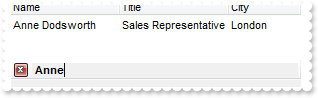
<BODY onload="Init()">
<OBJECT CLASSID="clsid:09C0C400-3A0F-4CD3-8B93-8D42FCE66726" id="Gantt1"></OBJECT>

<SCRIPT LANGUAGE="VBScript">
Function Init()
	With Gantt1
		.BeginUpdate
		.ColumnAutoResize = True
		.ContinueColumnScroll = 0
		.MarkSearchColumn = False
		.SearchColumnIndex = 1
		.FilterBarPromptVisible = True ' True
		.FilterBarPromptType = 258 ' FilterPromptEnum.exFilterPromptCaseSensitive Or FilterPromptEnum.exFilterPromptContainsAny
		.FilterBarPromptPattern = "Anne"
		.Chart.PaneWidth(True) = 0
		With .Columns
			.Add("Name").Width = 96
			.Add("Title").Width = 96
			.Add "City"
		End With
		With .Items
			h0 = .AddItem("Nancy Davolio")
			.CellCaption(h0,1) = "Sales Representative"
			.CellCaption(h0,2) = "Seattle"
			h0 = .AddItem("Andrew Fuller")
			.CellCaption(h0,1) = "Vice President, Sales"
			.CellCaption(h0,2) = "Tacoma"
			.SelectItem(h0) = True
			h0 = .AddItem("Janet Leverling")
			.CellCaption(h0,1) = "Sales Representative"
			.CellCaption(h0,2) = "Kirkland"
			h0 = .AddItem("Margaret Peacock")
			.CellCaption(h0,1) = "Sales Representative"
			.CellCaption(h0,2) = "Redmond"
			h0 = .AddItem("Steven Buchanan")
			.CellCaption(h0,1) = "Sales Manager"
			.CellCaption(h0,2) = "London"
			h0 = .AddItem("Michael Suyama")
			.CellCaption(h0,1) = "Sales Representative"
			.CellCaption(h0,2) = "London"
			h0 = .AddItem("Robert King")
			.CellCaption(h0,1) = "Sales Representative"
			.CellCaption(h0,2) = "London"
			h0 = .AddItem("Laura Callahan")
			.CellCaption(h0,1) = "Inside Sales Coordinator"
			.CellCaption(h0,2) = "Seattle"
			h0 = .AddItem("Anne Dodsworth")
			.CellCaption(h0,1) = "Sales Representative"
			.CellCaption(h0,2) = "London"
		End With
		.EndUpdate
	End With
End Function
</SCRIPT>
</BODY>
|
|
711
|
Is it possible to list only items that ends with any of specified strings
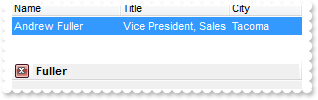
<BODY onload="Init()">
<OBJECT CLASSID="clsid:09C0C400-3A0F-4CD3-8B93-8D42FCE66726" id="Gantt1"></OBJECT>

<SCRIPT LANGUAGE="VBScript">
Function Init()
	With Gantt1
		.BeginUpdate
		.ColumnAutoResize = True
		.ContinueColumnScroll = 0
		.MarkSearchColumn = False
		.SearchColumnIndex = 1
		.FilterBarPromptVisible = True ' True
		.FilterBarPromptType = 4
		.FilterBarPromptColumns = "0"
		.FilterBarPromptPattern = "Fuller"
		.Chart.PaneWidth(True) = 0
		With .Columns
			.Add("Name").Width = 96
			.Add("Title").Width = 96
			.Add "City"
		End With
		With .Items
			h0 = .AddItem("Nancy Davolio")
			.CellCaption(h0,1) = "Sales Representative"
			.CellCaption(h0,2) = "Seattle"
			h0 = .AddItem("Andrew Fuller")
			.CellCaption(h0,1) = "Vice President, Sales"
			.CellCaption(h0,2) = "Tacoma"
			.SelectItem(h0) = True
			h0 = .AddItem("Janet Leverling")
			.CellCaption(h0,1) = "Sales Representative"
			.CellCaption(h0,2) = "Kirkland"
			h0 = .AddItem("Margaret Peacock")
			.CellCaption(h0,1) = "Sales Representative"
			.CellCaption(h0,2) = "Redmond"
			h0 = .AddItem("Steven Buchanan")
			.CellCaption(h0,1) = "Sales Manager"
			.CellCaption(h0,2) = "London"
			h0 = .AddItem("Michael Suyama")
			.CellCaption(h0,1) = "Sales Representative"
			.CellCaption(h0,2) = "London"
			h0 = .AddItem("Robert King")
			.CellCaption(h0,1) = "Sales Representative"
			.CellCaption(h0,2) = "London"
			h0 = .AddItem("Laura Callahan")
			.CellCaption(h0,1) = "Inside Sales Coordinator"
			.CellCaption(h0,2) = "Seattle"
			h0 = .AddItem("Anne Dodsworth")
			.CellCaption(h0,1) = "Sales Representative"
			.CellCaption(h0,2) = "London"
		End With
		.EndUpdate
	End With
End Function
</SCRIPT>
</BODY>
|
|
710
|
Is it possible to list only items that ends with any of specified strings
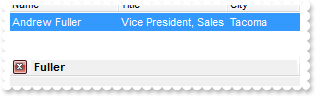
<BODY onload="Init()">
<OBJECT CLASSID="clsid:09C0C400-3A0F-4CD3-8B93-8D42FCE66726" id="Gantt1"></OBJECT>

<SCRIPT LANGUAGE="VBScript">
Function Init()
	With Gantt1
		.BeginUpdate
		.ColumnAutoResize = True
		.ContinueColumnScroll = 0
		.MarkSearchColumn = False
		.SearchColumnIndex = 1
		.FilterBarPromptVisible = True ' True
		.FilterBarPromptType = 4
		.FilterBarPromptColumns = "0"
		.FilterBarPromptPattern = "Fuller"
		.Chart.PaneWidth(True) = 0
		With .Columns
			.Add("Name").Width = 96
			.Add("Title").Width = 96
			.Add "City"
		End With
		With .Items
			h0 = .AddItem("Nancy Davolio")
			.CellCaption(h0,1) = "Sales Representative"
			.CellCaption(h0,2) = "Seattle"
			h0 = .AddItem("Andrew Fuller")
			.CellCaption(h0,1) = "Vice President, Sales"
			.CellCaption(h0,2) = "Tacoma"
			.SelectItem(h0) = True
			h0 = .AddItem("Janet Leverling")
			.CellCaption(h0,1) = "Sales Representative"
			.CellCaption(h0,2) = "Kirkland"
			h0 = .AddItem("Margaret Peacock")
			.CellCaption(h0,1) = "Sales Representative"
			.CellCaption(h0,2) = "Redmond"
			h0 = .AddItem("Steven Buchanan")
			.CellCaption(h0,1) = "Sales Manager"
			.CellCaption(h0,2) = "London"
			h0 = .AddItem("Michael Suyama")
			.CellCaption(h0,1) = "Sales Representative"
			.CellCaption(h0,2) = "London"
			h0 = .AddItem("Robert King")
			.CellCaption(h0,1) = "Sales Representative"
			.CellCaption(h0,2) = "London"
			h0 = .AddItem("Laura Callahan")
			.CellCaption(h0,1) = "Inside Sales Coordinator"
			.CellCaption(h0,2) = "Seattle"
			h0 = .AddItem("Anne Dodsworth")
			.CellCaption(h0,1) = "Sales Representative"
			.CellCaption(h0,2) = "London"
		End With
		.EndUpdate
	End With
End Function
</SCRIPT>
</BODY>
|
|
709
|
Is it possible to list only items that starts with any of specified strings
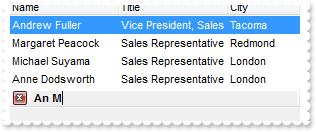
<BODY onload="Init()">
<OBJECT CLASSID="clsid:09C0C400-3A0F-4CD3-8B93-8D42FCE66726" id="Gantt1"></OBJECT>

<SCRIPT LANGUAGE="VBScript">
Function Init()
	With Gantt1
		.BeginUpdate
		.ColumnAutoResize = True
		.ContinueColumnScroll = 0
		.MarkSearchColumn = False
		.SearchColumnIndex = 1
		.FilterBarPromptVisible = True ' True
		.FilterBarPromptType = 3
		.FilterBarPromptColumns = "0"
		.FilterBarPromptPattern = "An M"
		.Chart.PaneWidth(True) = 0
		With .Columns
			.Add("Name").Width = 96
			.Add("Title").Width = 96
			.Add "City"
		End With
		With .Items
			h0 = .AddItem("Nancy Davolio")
			.CellCaption(h0,1) = "Sales Representative"
			.CellCaption(h0,2) = "Seattle"
			h0 = .AddItem("Andrew Fuller")
			.CellCaption(h0,1) = "Vice President, Sales"
			.CellCaption(h0,2) = "Tacoma"
			.SelectItem(h0) = True
			h0 = .AddItem("Janet Leverling")
			.CellCaption(h0,1) = "Sales Representative"
			.CellCaption(h0,2) = "Kirkland"
			h0 = .AddItem("Margaret Peacock")
			.CellCaption(h0,1) = "Sales Representative"
			.CellCaption(h0,2) = "Redmond"
			h0 = .AddItem("Steven Buchanan")
			.CellCaption(h0,1) = "Sales Manager"
			.CellCaption(h0,2) = "London"
			h0 = .AddItem("Michael Suyama")
			.CellCaption(h0,1) = "Sales Representative"
			.CellCaption(h0,2) = "London"
			h0 = .AddItem("Robert King")
			.CellCaption(h0,1) = "Sales Representative"
			.CellCaption(h0,2) = "London"
			h0 = .AddItem("Laura Callahan")
			.CellCaption(h0,1) = "Inside Sales Coordinator"
			.CellCaption(h0,2) = "Seattle"
			h0 = .AddItem("Anne Dodsworth")
			.CellCaption(h0,1) = "Sales Representative"
			.CellCaption(h0,2) = "London"
		End With
		.EndUpdate
	End With
End Function
</SCRIPT>
</BODY>
|
|
708
|
Is it possible to list only items that starts with specified string
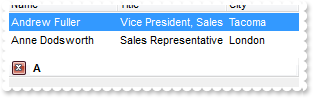
<BODY onload="Init()">
<OBJECT CLASSID="clsid:09C0C400-3A0F-4CD3-8B93-8D42FCE66726" id="Gantt1"></OBJECT>

<SCRIPT LANGUAGE="VBScript">
Function Init()
	With Gantt1
		.BeginUpdate
		.ColumnAutoResize = True
		.ContinueColumnScroll = 0
		.MarkSearchColumn = False
		.SearchColumnIndex = 1
		.FilterBarPromptVisible = True ' True
		.FilterBarPromptType = 3
		.FilterBarPromptColumns = "0"
		.FilterBarPromptPattern = "A"
		.Chart.PaneWidth(True) = 0
		With .Columns
			.Add("Name").Width = 96
			.Add("Title").Width = 96
			.Add "City"
		End With
		With .Items
			h0 = .AddItem("Nancy Davolio")
			.CellCaption(h0,1) = "Sales Representative"
			.CellCaption(h0,2) = "Seattle"
			h0 = .AddItem("Andrew Fuller")
			.CellCaption(h0,1) = "Vice President, Sales"
			.CellCaption(h0,2) = "Tacoma"
			.SelectItem(h0) = True
			h0 = .AddItem("Janet Leverling")
			.CellCaption(h0,1) = "Sales Representative"
			.CellCaption(h0,2) = "Kirkland"
			h0 = .AddItem("Margaret Peacock")
			.CellCaption(h0,1) = "Sales Representative"
			.CellCaption(h0,2) = "Redmond"
			h0 = .AddItem("Steven Buchanan")
			.CellCaption(h0,1) = "Sales Manager"
			.CellCaption(h0,2) = "London"
			h0 = .AddItem("Michael Suyama")
			.CellCaption(h0,1) = "Sales Representative"
			.CellCaption(h0,2) = "London"
			h0 = .AddItem("Robert King")
			.CellCaption(h0,1) = "Sales Representative"
			.CellCaption(h0,2) = "London"
			h0 = .AddItem("Laura Callahan")
			.CellCaption(h0,1) = "Inside Sales Coordinator"
			.CellCaption(h0,2) = "Seattle"
			h0 = .AddItem("Anne Dodsworth")
			.CellCaption(h0,1) = "Sales Representative"
			.CellCaption(h0,2) = "London"
		End With
		.EndUpdate
	End With
End Function
</SCRIPT>
</BODY>
|
|
707
|
How can I specify that the list should include any of the seqeunces in the pattern
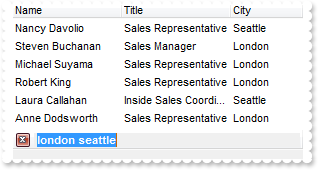
<BODY onload="Init()">
<OBJECT CLASSID="clsid:09C0C400-3A0F-4CD3-8B93-8D42FCE66726" id="Gantt1"></OBJECT>

<SCRIPT LANGUAGE="VBScript">
Function Init()
	With Gantt1
		.BeginUpdate
		.ColumnAutoResize = True
		.ContinueColumnScroll = 0
		.MarkSearchColumn = False
		.SearchColumnIndex = 1
		.FilterBarPromptVisible = True ' True
		.FilterBarPromptType = 2
		.FilterBarPromptPattern = "london seattle"
		.Chart.PaneWidth(True) = 0
		With .Columns
			.Add("Name").Width = 96
			.Add("Title").Width = 96
			.Add "City"
		End With
		With .Items
			h0 = .AddItem("Nancy Davolio")
			.CellCaption(h0,1) = "Sales Representative"
			.CellCaption(h0,2) = "Seattle"
			h0 = .AddItem("Andrew Fuller")
			.CellCaption(h0,1) = "Vice President, Sales"
			.CellCaption(h0,2) = "Tacoma"
			.SelectItem(h0) = True
			h0 = .AddItem("Janet Leverling")
			.CellCaption(h0,1) = "Sales Representative"
			.CellCaption(h0,2) = "Kirkland"
			h0 = .AddItem("Margaret Peacock")
			.CellCaption(h0,1) = "Sales Representative"
			.CellCaption(h0,2) = "Redmond"
			h0 = .AddItem("Steven Buchanan")
			.CellCaption(h0,1) = "Sales Manager"
			.CellCaption(h0,2) = "London"
			h0 = .AddItem("Michael Suyama")
			.CellCaption(h0,1) = "Sales Representative"
			.CellCaption(h0,2) = "London"
			h0 = .AddItem("Robert King")
			.CellCaption(h0,1) = "Sales Representative"
			.CellCaption(h0,2) = "London"
			h0 = .AddItem("Laura Callahan")
			.CellCaption(h0,1) = "Inside Sales Coordinator"
			.CellCaption(h0,2) = "Seattle"
			h0 = .AddItem("Anne Dodsworth")
			.CellCaption(h0,1) = "Sales Representative"
			.CellCaption(h0,2) = "London"
		End With
		.EndUpdate
	End With
End Function
</SCRIPT>
</BODY>
|
|
706
|
How can I specify that all sequences in the filter pattern must be included in the list
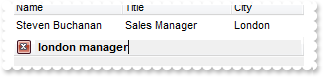
<BODY onload="Init()">
<OBJECT CLASSID="clsid:09C0C400-3A0F-4CD3-8B93-8D42FCE66726" id="Gantt1"></OBJECT>

<SCRIPT LANGUAGE="VBScript">
Function Init()
	With Gantt1
		.BeginUpdate
		.Chart.PaneWidth(True) = 0
		.ColumnAutoResize = True
		.ContinueColumnScroll = 0
		.MarkSearchColumn = False
		.SearchColumnIndex = 1
		.FilterBarPromptVisible = True ' True
		.FilterBarPromptType = 1
		.FilterBarPromptPattern = "london manager"
		With .Columns
			.Add("Name").Width = 96
			.Add("Title").Width = 96
			.Add "City"
		End With
		With .Items
			h0 = .AddItem("Nancy Davolio")
			.CellCaption(h0,1) = "Sales Representative"
			.CellCaption(h0,2) = "Seattle"
			h0 = .AddItem("Andrew Fuller")
			.CellCaption(h0,1) = "Vice President, Sales"
			.CellCaption(h0,2) = "Tacoma"
			.SelectItem(h0) = True
			h0 = .AddItem("Janet Leverling")
			.CellCaption(h0,1) = "Sales Representative"
			.CellCaption(h0,2) = "Kirkland"
			h0 = .AddItem("Margaret Peacock")
			.CellCaption(h0,1) = "Sales Representative"
			.CellCaption(h0,2) = "Redmond"
			h0 = .AddItem("Steven Buchanan")
			.CellCaption(h0,1) = "Sales Manager"
			.CellCaption(h0,2) = "London"
			h0 = .AddItem("Michael Suyama")
			.CellCaption(h0,1) = "Sales Representative"
			.CellCaption(h0,2) = "London"
			h0 = .AddItem("Robert King")
			.CellCaption(h0,1) = "Sales Representative"
			.CellCaption(h0,2) = "London"
			h0 = .AddItem("Laura Callahan")
			.CellCaption(h0,1) = "Inside Sales Coordinator"
			.CellCaption(h0,2) = "Seattle"
			h0 = .AddItem("Anne Dodsworth")
			.CellCaption(h0,1) = "Sales Representative"
			.CellCaption(h0,2) = "London"
		End With
		.EndUpdate
	End With
End Function
</SCRIPT>
</BODY>
|
|
705
|
How do I change at runtime the filter prompt
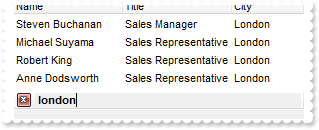
<BODY onload="Init()">
<OBJECT CLASSID="clsid:09C0C400-3A0F-4CD3-8B93-8D42FCE66726" id="Gantt1"></OBJECT>

<SCRIPT LANGUAGE="VBScript">
Function Init()
	With Gantt1
		.BeginUpdate
		.ColumnAutoResize = True
		.ContinueColumnScroll = 0
		.Chart.PaneWidth(True) = 0
		.MarkSearchColumn = False
		.SearchColumnIndex = 1
		.FilterBarPromptVisible = True ' True
		.FilterBarPromptPattern = "london manager"
		With .Columns
			.Add("Name").Width = 96
			.Add("Title").Width = 96
			.Add "City"
		End With
		With .Items
			h0 = .AddItem("Nancy Davolio")
			.CellCaption(h0,1) = "Sales Representative"
			.CellCaption(h0,2) = "Seattle"
			h0 = .AddItem("Andrew Fuller")
			.CellCaption(h0,1) = "Vice President, Sales"
			.CellCaption(h0,2) = "Tacoma"
			.SelectItem(h0) = True
			h0 = .AddItem("Janet Leverling")
			.CellCaption(h0,1) = "Sales Representative"
			.CellCaption(h0,2) = "Kirkland"
			h0 = .AddItem("Margaret Peacock")
			.CellCaption(h0,1) = "Sales Representative"
			.CellCaption(h0,2) = "Redmond"
			h0 = .AddItem("Steven Buchanan")
			.CellCaption(h0,1) = "Sales Manager"
			.CellCaption(h0,2) = "London"
			h0 = .AddItem("Michael Suyama")
			.CellCaption(h0,1) = "Sales Representative"
			.CellCaption(h0,2) = "London"
			h0 = .AddItem("Robert King")
			.CellCaption(h0,1) = "Sales Representative"
			.CellCaption(h0,2) = "London"
			h0 = .AddItem("Laura Callahan")
			.CellCaption(h0,1) = "Inside Sales Coordinator"
			.CellCaption(h0,2) = "Seattle"
			h0 = .AddItem("Anne Dodsworth")
			.CellCaption(h0,1) = "Sales Representative"
			.CellCaption(h0,2) = "London"
		End With
		.EndUpdate
	End With
End Function
</SCRIPT>
</BODY>
|
|
704
|
How do I specify to filter only a single column when using the filter prompt
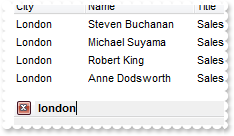
<BODY onload="Init()">
<OBJECT CLASSID="clsid:09C0C400-3A0F-4CD3-8B93-8D42FCE66726" id="Gantt1"></OBJECT>

<SCRIPT LANGUAGE="VBScript">
Function Init()
	With Gantt1
		.BeginUpdate
		.ColumnAutoResize = True
		.ContinueColumnScroll = 0
		.Chart.PaneWidth(True) = 0
		.MarkSearchColumn = False
		.SearchColumnIndex = 1
		.FilterBarPromptVisible = True ' True
		.FilterBarPromptColumns = "2,3"
		.FilterBarPromptPattern = "london"
		With .Columns
			.Add("Name").Width = 96
			.Add("Title").Width = 96
			.Add "City"
		End With
		With .Items
			h0 = .AddItem("Nancy Davolio")
			.CellCaption(h0,1) = "Sales Representative"
			.CellCaption(h0,2) = "Seattle"
			h0 = .AddItem("Andrew Fuller")
			.CellCaption(h0,1) = "Vice President, Sales"
			.CellCaption(h0,2) = "Tacoma"
			.SelectItem(h0) = True
			h0 = .AddItem("Janet Leverling")
			.CellCaption(h0,1) = "Sales Representative"
			.CellCaption(h0,2) = "Kirkland"
			h0 = .AddItem("Margaret Peacock")
			.CellCaption(h0,1) = "Sales Representative"
			.CellCaption(h0,2) = "Redmond"
			h0 = .AddItem("Steven Buchanan")
			.CellCaption(h0,1) = "Sales Manager"
			.CellCaption(h0,2) = "London"
			h0 = .AddItem("Michael Suyama")
			.CellCaption(h0,1) = "Sales Representative"
			.CellCaption(h0,2) = "London"
			h0 = .AddItem("Robert King")
			.CellCaption(h0,1) = "Sales Representative"
			.CellCaption(h0,2) = "London"
			h0 = .AddItem("Laura Callahan")
			.CellCaption(h0,1) = "Inside Sales Coordinator"
			.CellCaption(h0,2) = "Seattle"
			h0 = .AddItem("Anne Dodsworth")
			.CellCaption(h0,1) = "Sales Representative"
			.CellCaption(h0,2) = "London"
		End With
		.EndUpdate
	End With
End Function
</SCRIPT>
</BODY>
|
|
703
|
How do I change the prompt or the caption being displayed in the filter bar
<BODY onload="Init()">
<OBJECT CLASSID="clsid:09C0C400-3A0F-4CD3-8B93-8D42FCE66726" id="Gantt1"></OBJECT>

<SCRIPT LANGUAGE="VBScript">
Function Init()
	With Gantt1
		.BeginUpdate
		.Chart.PaneWidth(True) = 0
		.ColumnAutoResize = True
		.ContinueColumnScroll = 0
		.MarkSearchColumn = False
		.SearchColumnIndex = 1
		.FilterBarPromptVisible = True ' True
		.FilterBarPrompt = "changed"
		With .Columns
			.Add("Name").Width = 96
			.Add("Title").Width = 96
			.Add "City"
		End With
		.EndUpdate
	End With
End Function
</SCRIPT>
</BODY>
|
|
702
|
How do I enable the filter prompt feature
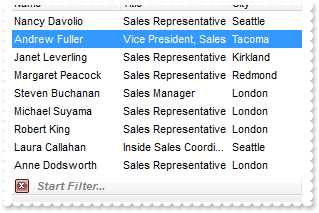
<BODY onload="Init()">
<OBJECT CLASSID="clsid:09C0C400-3A0F-4CD3-8B93-8D42FCE66726" id="Gantt1"></OBJECT>

<SCRIPT LANGUAGE="VBScript">
Function Init()
	With Gantt1
		.BeginUpdate
		.Chart.PaneWidth(True) = 0
		.ColumnAutoResize = True
		.ContinueColumnScroll = 0
		.MarkSearchColumn = False
		.SearchColumnIndex = 1
		.FilterBarPromptVisible = True ' True
		With .Columns
			.Add("Name").Width = 96
			.Add("Title").Width = 96
			.Add "City"
		End With
		With .Items
			h0 = .AddItem("Nancy Davolio")
			.CellCaption(h0,1) = "Sales Representative"
			.CellCaption(h0,2) = "Seattle"
			h0 = .AddItem("Andrew Fuller")
			.CellCaption(h0,1) = "Vice President, Sales"
			.CellCaption(h0,2) = "Tacoma"
			.SelectItem(h0) = True
			h0 = .AddItem("Janet Leverling")
			.CellCaption(h0,1) = "Sales Representative"
			.CellCaption(h0,2) = "Kirkland"
			h0 = .AddItem("Margaret Peacock")
			.CellCaption(h0,1) = "Sales Representative"
			.CellCaption(h0,2) = "Redmond"
			h0 = .AddItem("Steven Buchanan")
			.CellCaption(h0,1) = "Sales Manager"
			.CellCaption(h0,2) = "London"
			h0 = .AddItem("Michael Suyama")
			.CellCaption(h0,1) = "Sales Representative"
			.CellCaption(h0,2) = "London"
			h0 = .AddItem("Robert King")
			.CellCaption(h0,1) = "Sales Representative"
			.CellCaption(h0,2) = "London"
			h0 = .AddItem("Laura Callahan")
			.CellCaption(h0,1) = "Inside Sales Coordinator"
			.CellCaption(h0,2) = "Seattle"
			h0 = .AddItem("Anne Dodsworth")
			.CellCaption(h0,1) = "Sales Representative"
			.CellCaption(h0,2) = "London"
		End With
		.EndUpdate
	End With
End Function
</SCRIPT>
</BODY>
|
|
701
|
Is it possible to colour a particular column, I mean the cell's foreground color
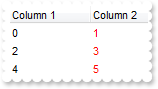
<BODY onload="Init()">
<OBJECT CLASSID="clsid:09C0C400-3A0F-4CD3-8B93-8D42FCE66726" id="Gantt1"></OBJECT>

<SCRIPT LANGUAGE="VBScript">
Function Init()
	With Gantt1
		.BeginUpdate
		With .ConditionalFormats.Add("1")
			.ForeColor = RGB(255,0,0)
			.ApplyTo = 1 ' &H1
		End With
		.MarkSearchColumn = False
		With .Columns
			.Add "Column 1"
			.Add "Column 2"
		End With
		With .Items
			.CellCaption(.AddItem(0),1) = 1
			.CellCaption(.AddItem(2),1) = 3
			.CellCaption(.AddItem(4),1) = 5
		End With
		.EndUpdate
	End With
End Function
</SCRIPT>
</BODY>
|